“I told you ‘bout the swans, that they live in the park….yes I told you that the light goes up and down, don’t you notice how the wheel goes round.” Badge. Cream
“There is nothing new in Wall Street. There can’t be because speculation is as old as the hills. Whatever happens in the stock market today has happened before and will happen again.” Jesse Livermore
Is the carnage in the stock market about to end? Or is this just the beginning of a serious bear market?
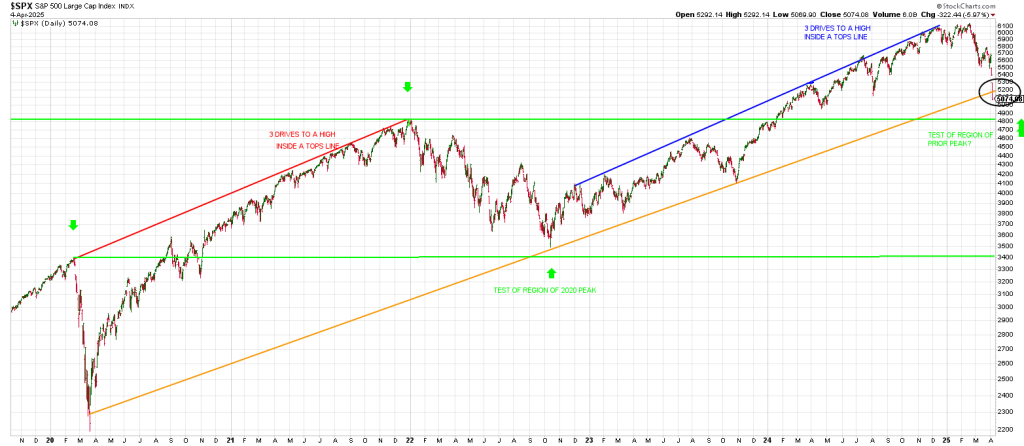
According to the Elliott Wave Theory, as we have argued throughout 2024, the market will put in a Super Cycle Top based on the wave structure from the 1932 bottom.
That does not mean that there will not be ferocious cyclical rallies within the context of a secular bear market.
There was a dynamic cyclical advance from July 1932 to March 1937 within the framework of a bear market.
There as a dramatic cyclical advance from October 2002 to October 2007 within the context of a bear market.
Notice both rallies were 5 years.
Let’s take a look at the big picture thru the lens of The Seer, W.D. Gann.
W D Gann wrote “When we start from Sunrise or the Horizon and measure to Noon, we get an arc of 90 degrees, which is straight up and down starting from the bottom.
90 months or 90 years is a very important time period. The 90 year Time Cycle is one of the very important ones because it is two times 45. This time period must always be watched at the end of long time periods.
For example: 1932 was 90 years from 1842. Study the Wheat prices around this time. 1850-1851, add 90 years and we get 1940-41. Note low prices of Wheat around that time.
1855, June, high for Wheat 170. 90 years from this period gives 1945. Wheat reached high in June, selling at 170, some contracts at 168 and 169.
1850-51, extreme lows for Wheat. Add 45 years and we get 1895 when extreme low was reached. From 1895 we again add 45 years and get 1940.”
Why is 45 important?
It is the total when adding the symbols 1 thru 9 together,
1 thru 9 is the foundation of the decimal number system
Gann is straight forward in telling us that 90 years and 45 years “must always be watched at the end of long time periods and that there appear to be multiple potential cyclical starting points.
45 years from the late 1929 top is late 1974 and a major bear market low.
45 years from late 1974 is late 2019 which ties to the pre-Covid Crash peak.
Since the Covid low we had a 5 year rally…synergistically related to the 1932 to 1937 rally…but probably not cyclically.
Based on the above we should be alert if we see high prices in 2019….90 years from 1929.
The market reached a primary high in January 2020 and a secondary false new high in February 2020 and crashed.
90 years after the brutal bear market bottom in July 1932 was the bear market low in October 2022.
October being 90 degrees square July.
Amazing
The 5 year cycle is very important. It is one-half the Decennial Cycle.
We have looked at the 5 year cycle in depth in this space.
For example, we had a 5 year explosive advance from 1995 to the 2000 Bubble Top.
It was 5 years from the major bear low in 1982 to the 1987 crash.
It was 5 years from the 2002 bear market low to the 2007 top and crash in ’08.
What I want to point out is that 5 years after the major 1932 low there was a rip your face off 5 year rally into 1937.
In other words we know that 90 years from the 1929 top and crash points to late 2019 which was the cusp of a crash in March 2020.
5 years from March 2020 we are getting another crash, just like the crash in 1937, 5 years from the 1932 low.
So, 1932 low gives a top and crash 5 years later.
5 years from 2020 top and crash marks a top and crash 5 years later.
It looks like the Spring of 2025 was just one of those juicy periods that WD Gann would have targeted for a high and a crash.
That’s one reason we have been forecasting exactly that.
A mirror image fold-back.
In our March 17th article, It’s Do or Die In the Heart of the Gann Crash Window, we walk through why we stated, “This Things Gonna Crash”.
We’re not going to delve into the key reason why Gann believed the 90 Year Cycle is important in this article. That is for another time.
But interestingly 45 years back from 2025 is 1980.
1980 is the Primary Low for the 1982 bear market bottom.
The DJIA 730 low in 1980 was MARCH.
The secondary low was in August 1980 at 770.
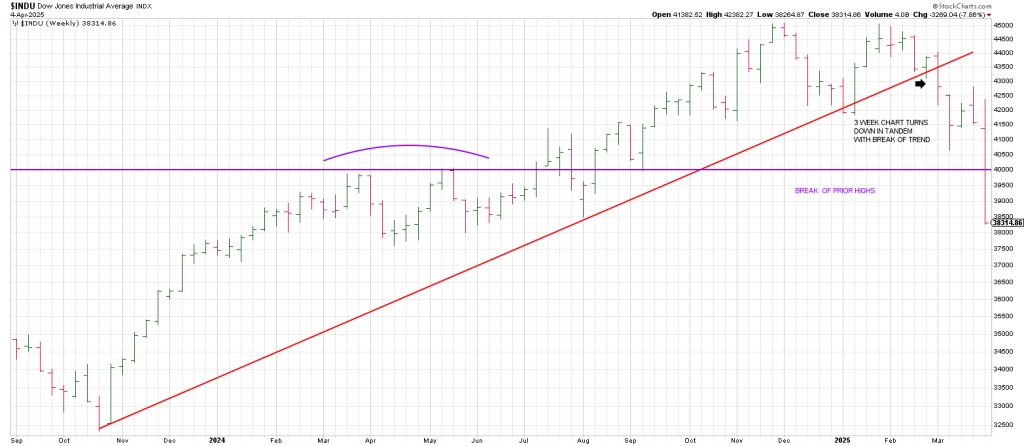
In March 2025 the DJIA left an important sell signal.
It broke trend from the low 29 months prior in October 2023.
This is the same 29 month period between the March 1980 low and the August 1982 low.
This is one of the reasons we believed that the culmination of a 45 year cycle would end in a thud in 2025.
A weekly DJIA shows the important 3 Week Chart turned down in early March coincident with the break of the trend line from October 2023.
Notice that the turn up of the Weekly Swing Chart on the week of March 24th defined a high.
When the DJIA turned its weeklies right back down last week we crashed.
My point is that Wall Street tells you the market can’t be timed, so don’t try it.
However the Bible tells you differently. It says “There is a time to sow and a time to reap.”
Mr. Gann was a student of the Bible. He believed it was a Book of Cycles.
I hope you have preserved your capital from the free articles posted here on Twitter/X.
Hit and Run members were prepared to capitalize on this crash.
They killed it with long positions in UVXY and SQQQ.
As well our reload of SPY and QQQ puts purchased a week ago were 4 baggers.
For more information about my approach to markets go to cooperhitandruntrading.com
Where you can also read a free ebook on the amazing Square of 9 Wheel which calculates turning points on all time frames.
I hope you reap happy trading harvests!.

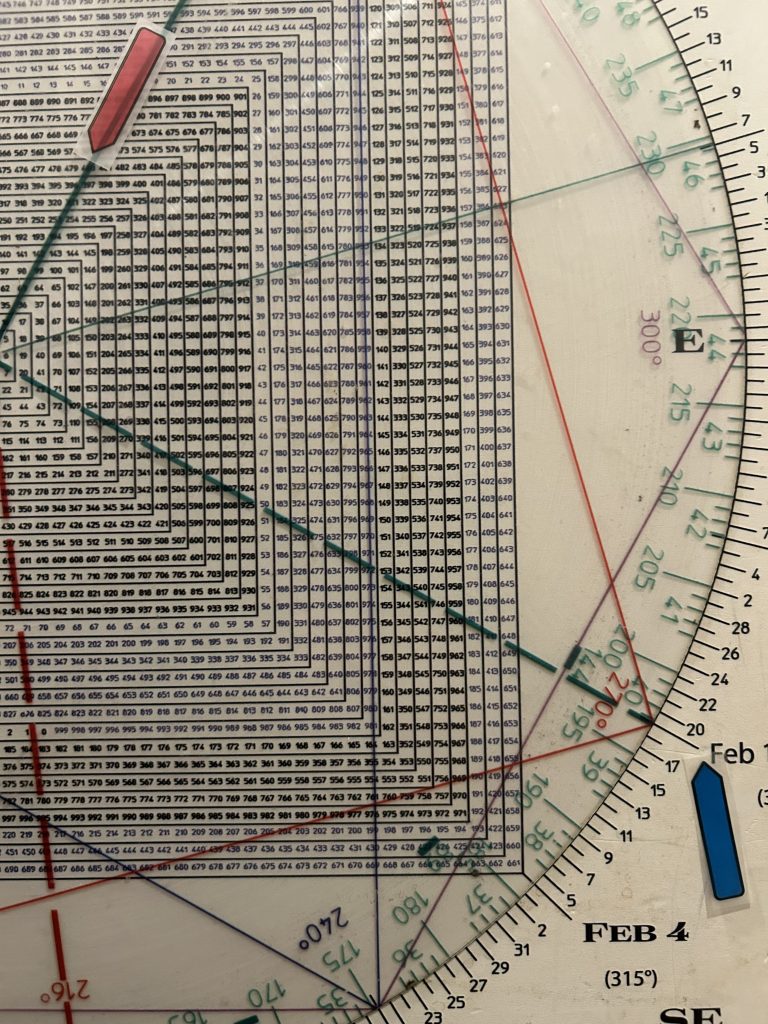
Square of 9 Wheel
Purchase your own Square of 9 Wheel. Shipping to US only. Contact Jeff for shipping outside the US.
John Templeton, a Rhodes Scholar and founder of the famous Templeton Growth Fund stated,
“The fluctuation of share prices is roughly proportional to the square root of the price.”
Legendary market operator, W D Gann took it one step further saying, “When TIME and Price square-out, expect a change in trend.”
Both of these market seers are referring to the Principle of Squares.
This is the cornerstone of how I forecast the big picture and the short-term trading picture.
Let’s take a look at one important example pointing to a crash in this Spring.
The July 1932 low was 92 1/2 years prior to January/February 2025.
On the Square of 9 Wheel, 92.5 (red) squares out with October 29th, the Big One in 1929.
92.5 is 180 degrees straight across and opposite January 24th, (blue) the Primary High in 2025.
Both 92.5 and January 24th are on the same axis as “1987” (purple).
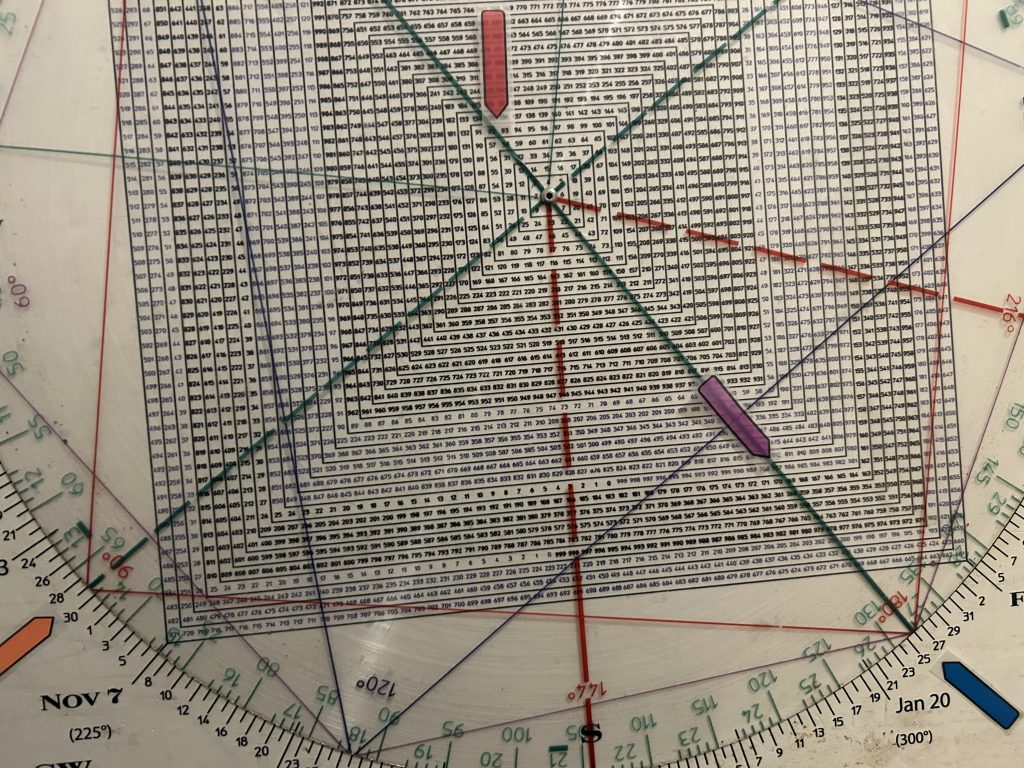
I have discovered using the numbers on the grid of the Square of 9 not just as price, but years is a remarkable forecasting method.
Many ask how the Square of 9 Wheel works.
To quote from one of my favorite movies, Sicario, “You’re asking me how a watch works. For now we’ll just keep an eye on the time.”
I can’t tell you why the Square of 9 Wheel works, but I know keeping an eye on it has made traders a lot of money.
The basis of the Sq of 9 Wheel goes back thousands of years to Egypt and India where Gann went to study it.
It is based on the Great Pyramid.
It is a two dimensional, birds-eye view of the Great Pyramid.
The number 1 in the center is the Capstone of the Pyramid.
The Wheel is our Watchman.
We were prepared and positioned for this decline and the passive/systematic crowd is bleeding.
Just buying ETF’s does not distinguish between stocks. All the components, good, bad and ugly are lumped together.
You can’t expect to make money in the markets doing the same thing as everybody else
Many market participants will blame the tariffs—because they always need a culprit.
But the truth is the news breaks with the cycles, not the other way around.
The tariffs were on the table as soon as the oath of office was delivered.
Yet Wall Street remained complacent. They can’t have their funymental cake and eat it too.
Wall Street remained complacent which leads me to believe that Thursday and Friday’s selling was a Sovereign Wealth Fund getting out of all U.S. stocks. That’s what I’m hearing.
It is consistent with the indiscriminate selling on Thursday and Friday.
In fact the way the market initially rallied on Wednesday during Trumps speech, it was as if a sell the rumor buy the fact trade was playing out; however, the way they Jackknifed before the end of the speech and continued to plunge on Thursday and Friday suggests to me that in addition to a sovereign Wealth Fund unloading that a gorilla is sitting on the futures. How do you say gorilla in Mandarin?
War is war and this is an economic war.
So never say never.
If I am correct, I am certain the Administration is aware of this by now and have a surprise up their sleeve.
In sum, I have warmed that the Gann Crash Window of 7 to 8 weeks from a high was thrown wide open starting last week.
Of course this is the same pattern in many crashes, most notably those in 1929 and 1987.
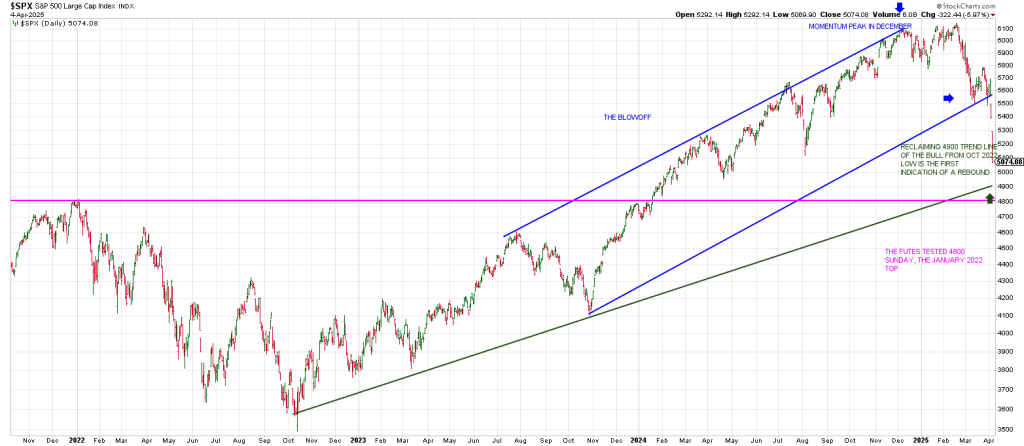
Anchoring “0” to the February 19 peak aligns with 502 SPY or 5020 SPX.
Breakage below 502 opened the door to the next 90 degree decrement lower which is 480 (or 4800).
There is a lot of synchronicity there in that 4800 was the January 2022 peak prior to a bear market.
In the same way, the 218 SPY low on March 23, 2020, squares March 23rd for a Time/Price Square-out.
Prior resistance becomes new support. The S&P futes were magnetized to 4800 on Sunday.
Our projection has been for an initial waterfall to the region where the last upleg started—from the August 5th 5119 Flash Crash low and the January 2022 high of 4800.
That the market would return to the scene of the crime.
We got there in one fell swoop.
The question now is whether the powers that be will “allow” a Black Monday.
The Fed’s hands may be tied as to cutting rates because of inflation…especially as the tariffs are seen as inflationary.
Much like the aftermath of the crash in 1929, the Fed did not cut rates.
They had warned about excess speculation throughout 1929.
When the crash came they were reluctant to cut fearing it could reignite another bubble.
Likewise having fought inflation on the heels of Covid the last few years the Fed is reluctant to start cutting rates in the face of tariffs.
I think economists as a rule…take for granted they know a lot of things. If they really knew so much, they would have all the money and we would have know.” Bernard Baruch
Since 1996 Hit and Run has been providing market timing and long/short swing trades and day trades.
Many of our original subscribers still trust us today a testament to our legacy of excellence which includes
Calling the top day in March 2000
The top day on the secondary top at the end of August 2000
The week of the 2002 low
The week of the 2007 high
The March 6, 2009 low
The Top region in 2018
The Christmas Crash in 2018
The January/February pattern top in 2020
The low day on March 2020 where we called for the SPX to rally to 4000 + within a year.
The top week in January 2022.
The January 2025 top adding, “this things gonna crash”.
The Nifty Fifty
@niftyfiftythe
I have followed/read this man for 23 years. Many ignore him and his wheel. He is the only one who has said “THIS THINGS GONNA CRASH”. Oh he goes long and short single names daily. LEGEND. Mr Jeff Cooper
In sum, today the 3 Day Rule is front and center. Markets play out in threes. Like the 3 day waterfall after the market re-opened after 9/11. That was the bottom …for a rally.
This 3 Day Spike is occurring at a test of “prior resistance being new support”…4800.
Again, 480 (4800) squares-out with Feb 19, the high for a possible Time/Price square-out.
I would not be surprised to see a 5% + rally if we recapture 4900 and HOLD.