“I was feeling kind of seasick
When the crowd called out for more” A Whiter Shade of Pale, Procol Harum
Below is from one of our February morning reports, entitled This Thing’s Gonna Crash
“I see the bad moon a-risin’
I see trouble on the way.” Creedence Clearwater Revival
“As a human being, one has been endowed with just enough intelligence to be able to see clearly how utterly inadequate that intelligence is when confronted with what exists.” Albert Einstein
“Any fool can believe the truth, it takes a genius to believe a palpable lie.” Anon
The intersection of technology and culture has produced a societal quickening.
Alvin Toffler’s radical 1970 book, Future Shock, theorized that things were changing so fast we would soon lose the ability to cope.
Well the future is now and most of us are finding it hard to adapt to The Quickening, the digital metamorphosis of the present.
This is particularly apparent in financial markets where it is hard to tell what’s driving markets, humans or machines. One day the market is trending higher and gets hit in the last hour, the next day is flat until the last hour and explodes.
Does big money all of a sudden decide it has had all day to do something but then en masse pulls the trigger in the last hour?
We were told the decimalization of the markets was to make things fairer for the retail trader but in truth it was to enable High Frequency Trading. The domain of the Algomatics.
Wall Street traders no longer invest in a future…which is what capitalism was supposed to be about:
They expect immediate profits off their algorithmic trades in an ultra fast momentism.
The tape has become entirely transactional, amplifying market concepts such as Soros Theory of Reflexivity as well as technical and fundamental methodologies.
I learned the markets from my dad who ran his private hedge fund.
He was the best tape reader I’ve ever met. He didn’t know anything about charts.
Reading the tape used to be like watching the wings of an eagle.
Now it’s like trying to decipher the wings of a humming bird.
It can’t be done.
Despite a tape that whiplashes from program to program and often feels like a vortex of seeming randomness and presentism , over a 40 year trading career I have thoroughly satisfied myself that the market is mathematical and deterministic.
As legendary market seer W.D. Gann stated, “Everything in existence is based on exact proportion and perfect relationship. There is no chance in nature, because mathematical principles of the highest order lie at the foundation of all things. Faraday said, There is nothing in the universe but mathematical points of force.”
In today’s markets there is little sense of the historic timescale which drive market’s progression; however, in truth, as Gann went on to say, “The future is but a repetition of the past, as the Bible plainly states….by studying past price records you will be able to prove to yourself history does repeat and by knowing the past you can tell the future. There is a definite relation between price and time. By studying time cycles and time periods you will learn why market tops and bottoms are found at certain times.”
To understand this we must look at time periods and cycles and understand as well that price moves in cycles.
Gann was a Texas Bible Belt Christian. He considered the Bible a scientific text on some level and that the Bible was a coded book of cycles which his book Tunnel Thru The Air borrows from to demonstrate “the process by which man may know all there is to know including the stock market.”
At this point you might be thinking “What does this have to do with the S&P 500 right now?”
Allow me to explain.
The Bible talks about a cycle of “time, times and half time”.
This works out to 360 days, 720 days and 180 days.
A total of 1260 days or 3 ½ years.
Two cycles of this time period is 7 years.
Two cycles is important. It takes two of anything to get a cycle. What is a cycle but a repeated pattern.
The number seven is the most mentioned number in Revelation in the Bible.
It is considered the number of time and the number of completeness.
Gann called it the fatal number.
The market bottomed in 1980 and tested that low in 1982.
7 years from 1980 is 1987 and Black Monday.
7 years after 1987 the market started a crash UP in late 1994 that lasted around 5 years into March 2000.
7 years from 1994 is 2001 and a crash in September, 9/11.
7 years from 2001 is 2008 and the Lehman Crash.
7 years from 2008 is 2015 and a crash in August. It was essentially a 2 wave crash with a second leg down into February 2016.
7 years from 2015 is 2022 and a slow motion train wreck.
7 years from 2022 is 2029 and the 100th anniversary of the 1929 crash.
That should be interesting.
How about backwards from 1980? You get 1973 when a 2 year crash started.
7 years before that was 1966 and the top of a secular bull market.
In addition to 7 year cycles, the market has a preponderance for waterfall events on years ending in 7:
1907, 1937, 1987, 2007.
If it were only that easy. The fact is there are many cycles running concurrently.
It is when you get a number of cycles clustering that there is a strong likelihood of an Event.
Even IF you were sure a panic high or low would occur in a “year 7” you would need to know WHEN in that year to expect it to capitalize on it.
There are interlocking 7 year cycles within other 7 year cycles.
Allow me to explain.
On August 21, 2017 there was a solar eclipse.
It marked a low from which one of the smoothest, most persistent, uninterrupted advances in history commenced. The SPX ran from 2417 to 2873 in 5 months (a fractal of the 5 YEAR runs that often play out such as 1995 to 2000).
It peaked on January 26, 2018 which ties closely to a LUNAR eclipse on January 31, 2018.
From the top on January 26, 2018 the market crashed, It gave up the entire FIVE MONTH rally in 9 TRADING DAYS.
The market had peaked 5 days before the eclipse.
Let’s fast forward today’s update:
Why did I think the market would top in January (Primary High) and begin to crash in February?
As explored in this space in November there was a confluence of overlapping natural cycles (versus market cycles) that was due to hit in January.
From a Primary High in January, the Gann Panic Zone indicates a last rally lower high around the 40th calendar day from high.
Downside momentum shows up from there accelerating around the 49th calendar day.
This is 7 squared days. Gann used this timing of the Crash Window because he found that 7 is the number of panic and 7 squared is 49 days.
The Climatic Low is at the start of the 8th week or the 55th to 56th calendar day.
This was the case in 1929 although the DJIA went on to make a new low on November 13th that year.
This was the case in 1987 although the SPX went on to make a new closing low on December 4th that year.
This was the case in 2020, except that the 55th day from the January 22 Primary High was March 18th and the
Market bottomed on March 23rd.
The market isn’t a Rolex.
The Square of 9 Wheel is. Often.
March 23 squares out with the 3393 FEBRUARY false high in 2020.
As well the 218 SPY low at the Covid Crash low squares out with March 23.
So that is the tale of 3 historic crashes.
In the case of 1929, 1987 and 2008 solar and lunar eclipses seem to be triggers in the crashes.
We walked through that synergy in a recent report.
The eclipse cycle is prominent here in March 2025.
A lunar eclipse occurred on March 14th.
A solar eclipse occurs on March 29th.
This was not the case in 2020. It was a headline driven crash versus a cyclical phenomenon.
This is one of the reasons I thought the March 23, 2020 would mark a low perpetuating a 100% move to over 4,000 SPX within a year and stated so in the report on March 23, 2020.
Let’s take a look at the current cycle which does revolve around both natural and market cycles.
But before that let’s mention the 49th day and the 55/56th day in the 1929 and 1987 crashes.
In 1929 the 49th calendar day from the September 3rd high was October 22.
The air came out of the bubble with the first of 3 crash days on October 24.
A 13% crash day occurred on the 55th day, October 28, 1929.
A 12% crash day occurred on the 56th day, October 29th, 1020.
In 1987 the 49th calendar day from the August 25th high was October 13. Downside acceleration showed up.
The 55th day was Black Monday, October 19, 1987.
The Primary High for the current cycle occurred on January 24th.
The 49th calendar day out is March 14th, this past Friday.
However, counting from the February 19th all-time high, the 49th calendar day is March 9th. The 56th calendar day is April 16th.
In some respects we are weaker than 1929.
In 1929 the DJIA closed below its 200 DMA on October 21st, day 48 from high.
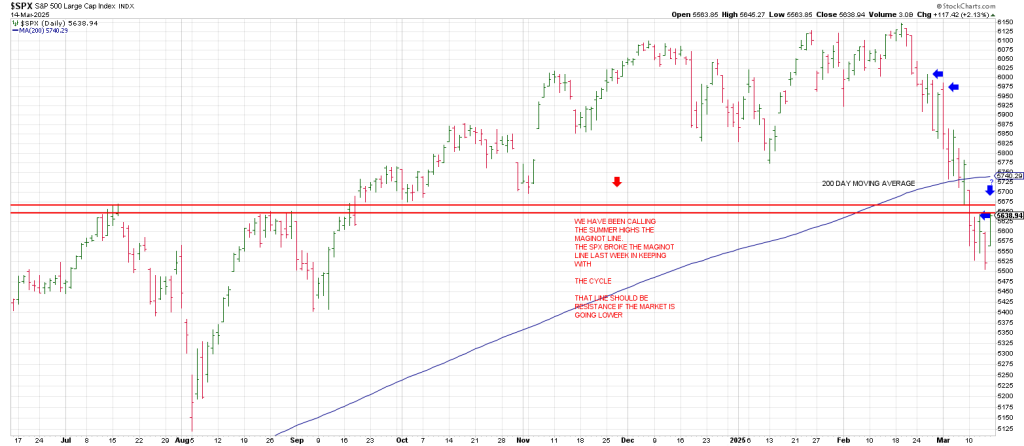
Here in 2025 the SPX closed below its 200 day moving average on March 10th, day 45 from high.
Will the waterfall phase in 2025 outpace that of 1929 and 1987?
I allude to 1929 because we are 93 years from 1932, the Great Depression price low.
This is the price low following the 1929 crash.
“The room was humming harder
And the ceiling flew away.”
Is the Great Depression low pointing to a Super Cycle Top in 2025?
The structure of the 93 year advance in Elliott Wave terms argues a Super Cycle Top may be on the table.
The degree of excess and magnitude of divergences also suggests a mega-top is playing out.
93 is 180 degrees opposition January 24th.
Most leading momentum stocks peaked between the January 24th Primary High and the February 19th Secondary High.
As WD Gann called it, “time on the side”.
Names include AAPL, META, AMZN, GOOG, PLTR, RDDT, CRWD, APP and NVDA to mention a few.
This is a key week.
If we’re going to waterfall lower, this is where the patterns and cycles say it happens.
If not and the SPX can hoist itself above its 200 day and sustain it pushing higher, theoretically something else may be going in on.
“When I called out for another drink
The waiter brought a tray.”
Today will be particularly interesting.
As the above daily SPX shows every time the Daily Swing Chart turned up on trade above a prior day’s high, it defined a pivot high with the index closing at/near its high of the day with the next session making a new low.
As well, we are in the heart of the Gann Panic Zone, if historic patterns paly out, Friday’s rally will be ghostly.
In sum, how can you manage risk if you can’t measure risk.
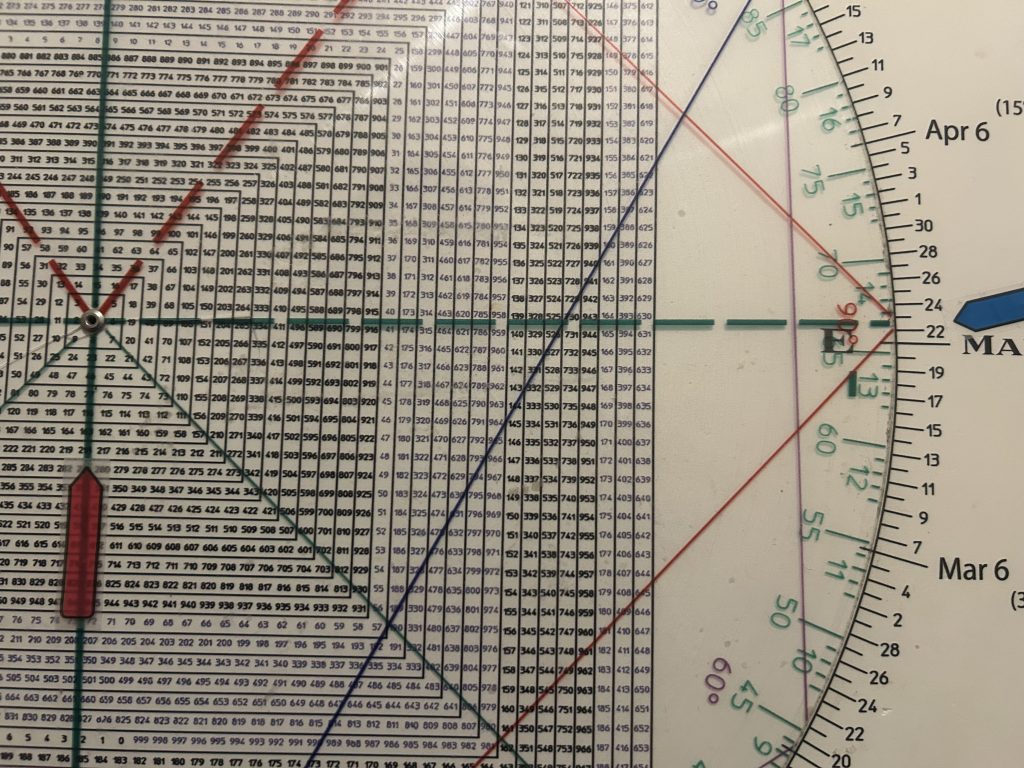
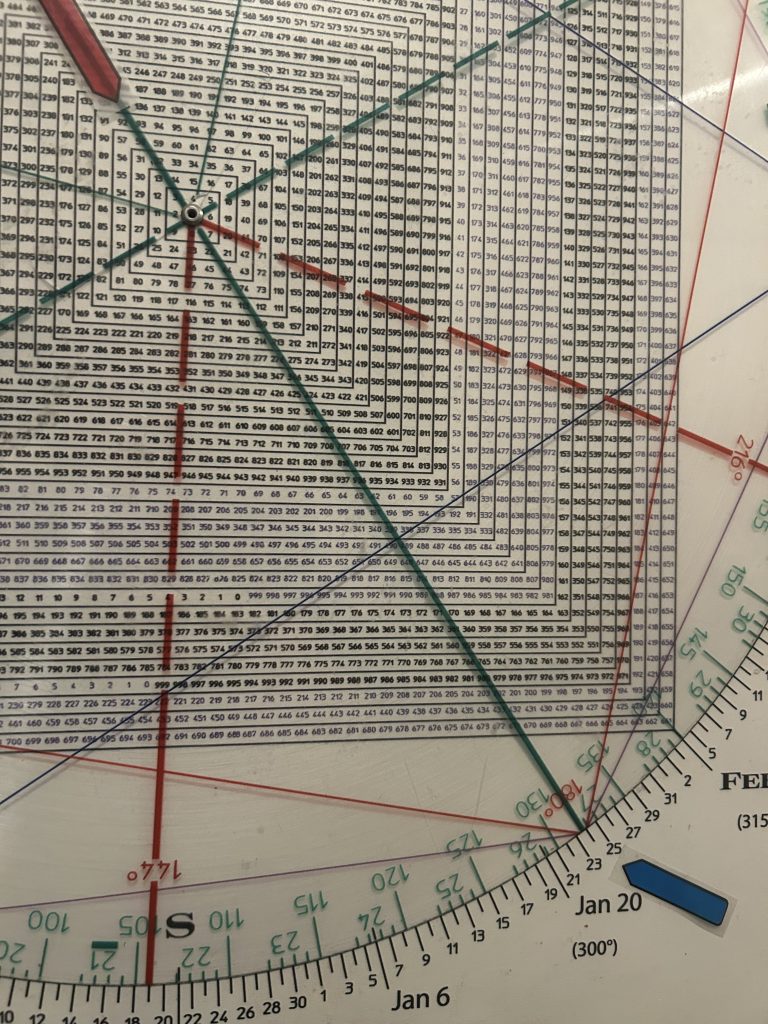
Our Square of 9 Wheel pictured below does just that.
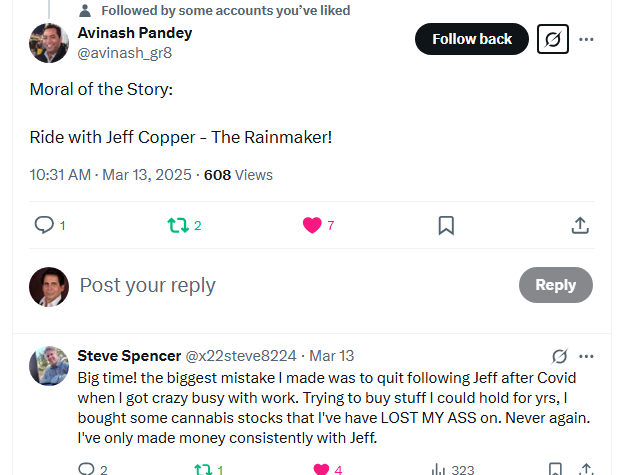
Here’s what Hit and Run members have to say:


While many say the only way to make money is to be in the market for the long haul, the Bible says there is a time to sow and a time to reap.
There is a time to buy and a time to sell.
After 15 years, the Buy the Dip mentality is so ingrained that Friday’s rally produce of chorus of those banging the table that an important low was on the table.
For example, reports show that affluent and high net-worth inflows to US equities hit 2% as a share of BofA’s assets under management last week, the third highest on record.
Such a surge in purchases has not been seen for 2.5 years when inflows hit 6% of AUM in September 2022, near the bottom of a short-term bear market.
Buy the Dip reigns. Wealthy individuals are adding stocks to their portfolios as the SPX has recorded its fastest 3 week decline since 2020.
That’s only one instance. Hard to bet on. It would be interesting to see what wealthy individuals were doing over the last 40 years or so since the major bottom in 1982.
I don’t have the stats, but I’d put good money that wealthy individuals were NOT buying in the summer of 1982.
What were they doing in 1987? A crash that was a bottom.
Moreover, I suspect that market participants were buying all the way down after the 1929 crash looking for the strength of the prior 5 years to be revisited.
A time when Buy the Dip decimated investors.
I suspect that more money was lost by individuals who chased darlings like RCA all the way down into the 1932 low than was lost in the crash itself.
Like CSCO after the 2000 top.
Like the twins, TSLA and NVDA in 2025?
“And so it was that later
As the miller told his tale
That her face at first just ghostly
Turned a whiter shade of pale.”