“I’m looking through you, where did you go
I thought I knew you, what did I know” I’m Looking Through You, The Beatles
Last week we flagged a potential Time/Price square-out on the SPX at 631/632 and July 18.
The SPX struck a high of 6314 just after the open and tailed off to close near the low of the day leaving a Gilligan Island sell signal
A Gilligan is a gap up to a new 60 day high with a close at/near session lows.
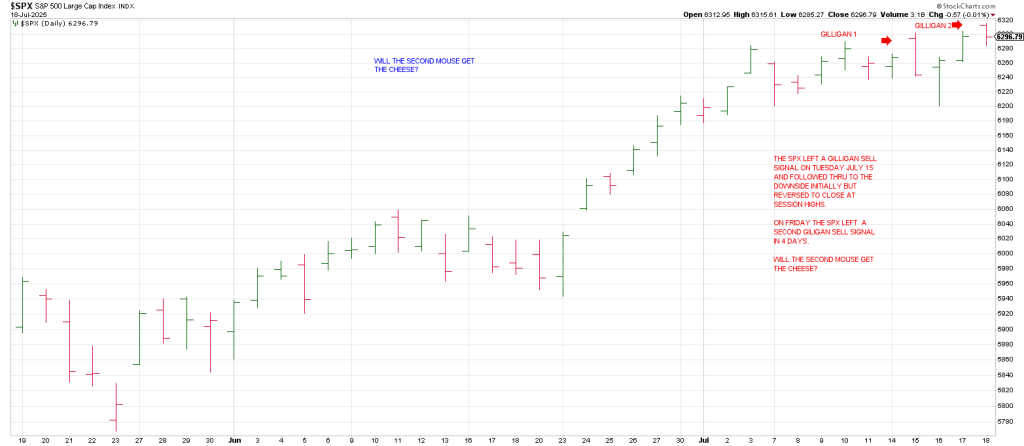
Friday just wasn’t a gap up to a new 60 day high; the index scored a Gilligan on a gap up to a new al time high.
Of course we know that follow thru is key—the signal is hollow unless we get downside follow through over coming days without taking out Friday’s high.
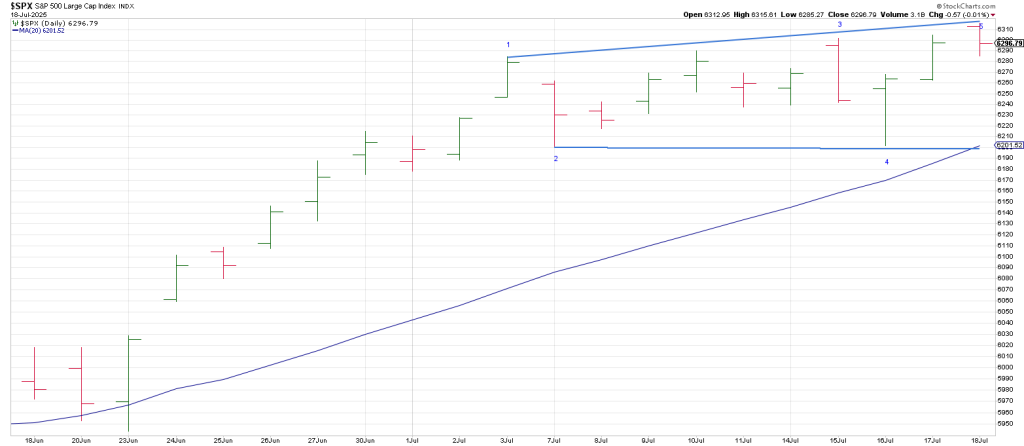
At the same time, Friday’s new high carved out a mini Megaphone Top starting from July 3rd.
This is a 5 point pattern of higher highs and lower lows.
QQQ also left a second Gilligan sell signal within a week.
Will it prove to be an eventful anniversary of the July 2007 Primary High?
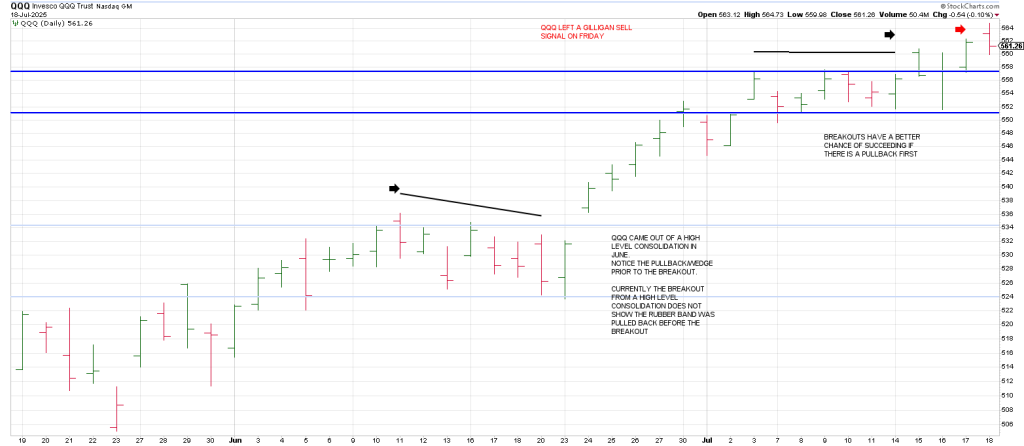
If the Q’s snap the 3 Day Chart low at the 551 region it will be the first sign of a change in trend.
Keep in mind the 3 Day Chart in the Q’s has turned own only twice since the April low—
On May 7th and on June 20th. Neither were broken (on June 21st the Q’s dipped below the June 20 low and turned up sharply).
Both defined lows prior to explosive upside continuation.
Consequently breakage below the 3 Day Chart low with downside follow through opens the down door. Full stop.
For the moment, it’s interesting that Friday’s 565 reversal high is on the Cardinal Cross—those are the numbers on the vertical and horizontal axis on the Square of 9 Wheel.
These numbers are consider to have more ‘natural’ power.
At the same time there were some notable dents in the Generals.
After beating estimates, NFLX dove below its 50 day line with authority breaking a Neck Line as well.
Is this a precursor to other generals action as earnings season gets in full swing?
Are the leaders on stilts priced for perfection?
A couple more plumb line drops like NFLX and money managers may start trimming and asking questions later before their own managers demand “What were you waiting for, Christmas?”
That’s a pertinent question because 7 Gann Panic years ago there was a Christmas Crash in 2018.
SPOT is another big winner that has pulled back from 780 to 685 in 3 weeks and is testing its 50 day line.
It too may be carving out a Head and Shoulders Top.
CVNA left a large range Key Reversal day on July 8th and has pulled back to its 20 dma where it rebounded sharply.
However, importantly, CVNA may have struck a primary high in early June where it sold off sharply.
The early July Key Reversal Day may be a Secondary High.
As W D Gann stated, it is the Secondary High or test failure of the primary high on a ‘return rally’ that is the best place to short.
CRWD is suspect tracing out what looks like a Bear Flag on its 50 day line.
CRCL reversed sharply on Friday from the 260 square-out flagged on the private twitter feed.
CRDO left a Key Reversal Day on Thursday and importantly followed thru with authority on Friday.
To mention a few.
In sum, while the cycles warn, we have not seen a break of even initial support.
That said the market often changes trend like a thief in the night.
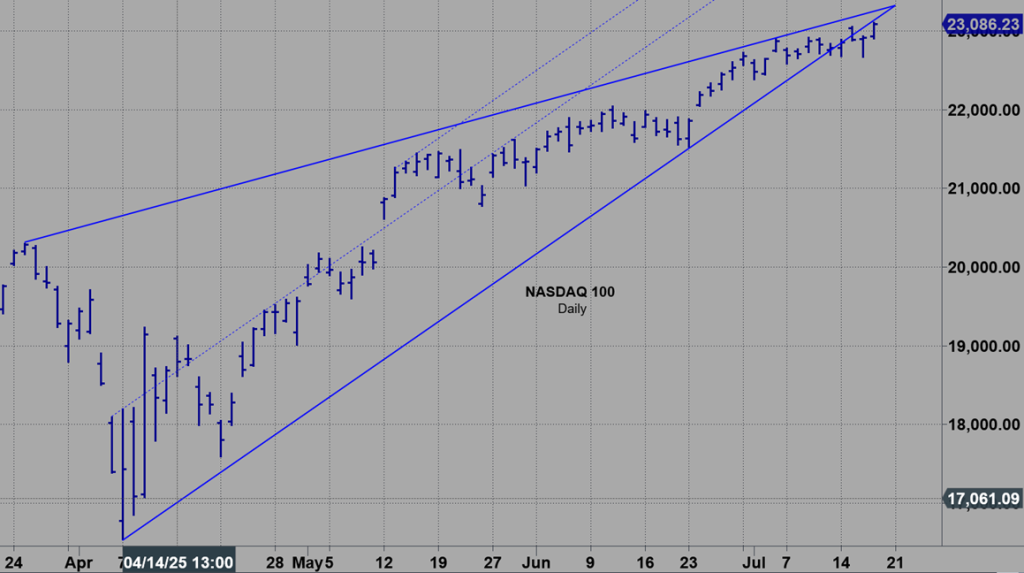
Most players expect the market is going to ring the door bell like the FedEx guy with a “sell package” But I think there is a strong likelihood it’s going to ring the bell like a gorilla given the NDX Rising Wedge from Thursday show below.
Breaks from Rising Wedges are dramatic.
With a break of this wedge expect the mouse that roared.