“Like a freight train moving with a simple twist of fate.” Simple Twist Of Fate, Bob Dylan
Up until Friday the market was tracing out a picture perfect counter-trend rally into resistance in the form of a declining trend channel and a bearish 3rd lower high.
We observed in Friday morning’s report that the SPX showed a textbook sell setup…maybe too text book.
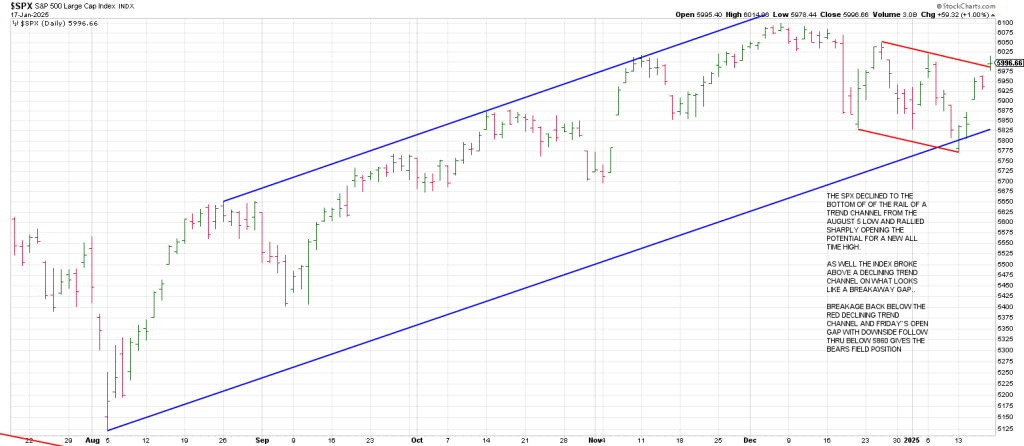
On January 13 the SPX declined to the bottom rail of a trend channel (blue) from the August 5th low and rallied sharply opening the door for a new all-time high.
As well, the index broke above a declining trend channel (red) on what looks like, for the moment, a Breakaway Gap.
The upside potential must be respected as this is the second gap up off a meaningful low.
It was a meaningful low for two reasons:
1) 5791 satisfied a 360 degree decline from the 6100 all-time high. The Jan 13 low was 5674 with a close at 5835. The Gap down to a new 60 day low with a close at/near session highs left a Gilligan sell signal. A strategy I developed to identify a trend turn…be it short term, intermediate or major.
2) The Dec 13 low tagged the bottom of the aforesaid trend channel.
Breakage back below the top rail of the red declining trend channel and Friday’s opening gap over coming days will trigger a Jump the Creek sell signal. Downside follow thru below 5860 giving the bears field position once again.
Why 5860? That is the first of the gaps up off the trend channel.
5860 is also 270 degrees or 3 squares of 90 degree decrements down from the high.
On Friday the bears snatched defeat from the jaws of the bull.
For the moment.
But we must be mindful that Friday was a monthly OpEx. Anything can happen on a monthly OpEx, especially with the cross currents attending the first one of the year.
Friday was not a head-line drive Gap & Go suggesting there was an agenda that was options related.
Everything I have read over the weekend, most notably from the bear camp, is a CYA…
In market terms…Capitulating Ya All.
They are clamoring about a “breakout”
I get it.
But for the most part they are only looking at Price, not Time.
Yes if you judge the market only by price here, we have a breakout— IF we get follow thru.
Lot’s of 1 day “breakouts” prove to be Pinocchio’s.
But, even if we get follow thru with the potential for the nominal new high we have allowed for, it would be a significant intermarket divergence.
The DJIA and QQQ would likely not strike new highs.
So while Friday’s price action has many market participants euphoric, let’s look at time.
With respect to Time, this week is the 7th week from the all-time high.
This week opens the Gann Panic Window.
That does not mean panicky selling must start; it means if it is going to, this is when it will begin.
W. D. Gann stated “7 is the number of time. It is the fatal number. It is the number of panic.”
7 squared is 49 days. The 49 day from the high in 1929 started a waterfall decline.
Ditto 1987.
There are other examples, but these are the most famous.
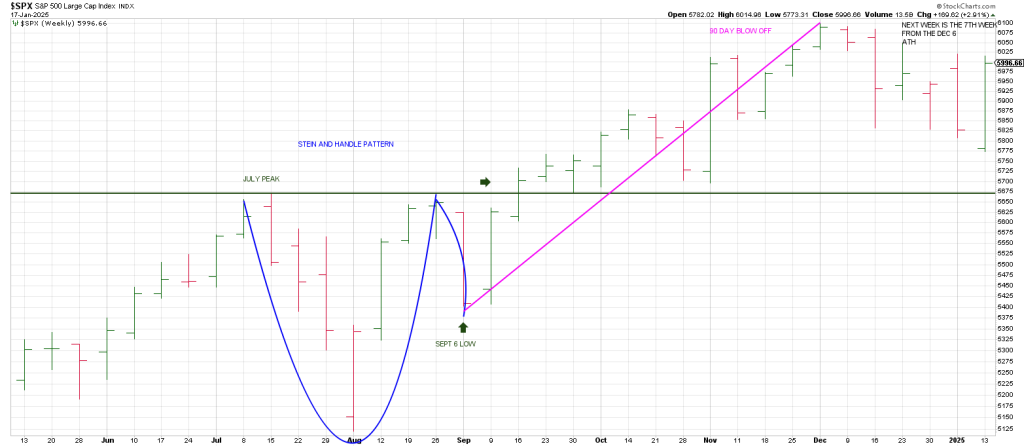
Notably both of those crashes followed parabolic blow-offs of 90 to 100 days.
Checking the SPX weeklies shows that from the September 6th low the SPX broke out above its July peak.
90 days/degrees later is the SPX all-time high on December 6th.
The analogue is eerily similar to those two prior crash years.
Last year we discussed the idea that September may be a mirror image foldback to the 1929 high.
Interestingly the top of the blow-off in 1929 was September 3rd.
Last year September 6th marked the low prior to the start of a blow-off.
Even if the SPX does strike a new high, caution is warranted as big tops have an affinity for big traps.
The October 2007 high was a double Bull Trap.
It was a higher high than the Primary High in July that year as well as a slightly higher high than the March 2000 top. The March 2000 high on the SPX was 1552.87. The July 2007 high was 1555.90. The October 2007 final high was 1576.09.
The 2008 GFC debacle followed.
Fast moves come from false moves.
The premise of a Bull Trap if the SPX should make a new high must be respected .
Why did the SPX Jackknife to a new high in October 2007 from a Swan Dive in July?
Time and Price squared-out: 1576 squares out with October 7th.
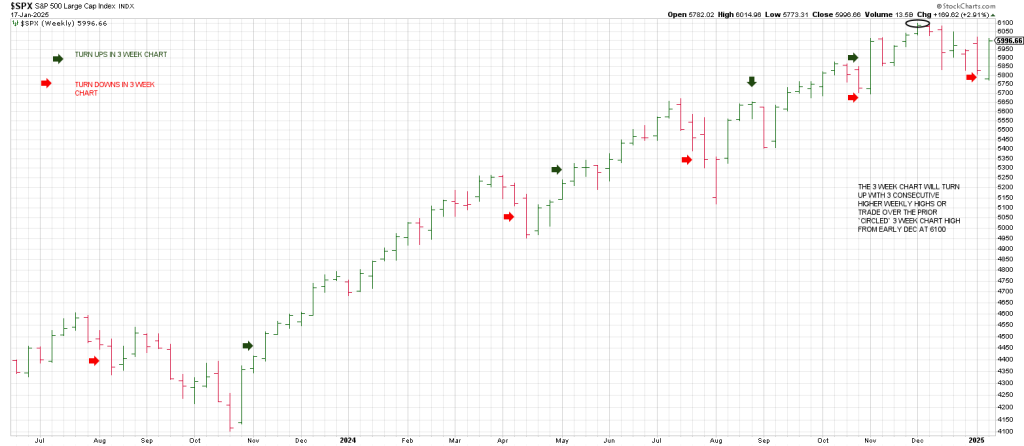
Let’s examine the behavior of the SPX and its 3 Week Chart since the October 2023 low.
The 3 Week Chart (and the 3 Day Chart and 3 Month Chart) are key components of the Hit and Run Methodology. They do a good job of defining the trend.
The 3 Week Chart turns down with 3 consecutive lower weekly lows (they do not need to be 3 consecutive lower weekly CLOSING lows).
The 3 Week Chart turns up with 3 consecutive higher weekly highs (they do not need to be 3 consecutive higher weekly CLOSING highs).
A weekly SPX from 2023 shows that from the Oct 2023 low, the 3 Week Chart turned up as soon as it could have—on the 3rd week off the low—and bullishly price extended, rallying all the way to late March 2024.
A turn down in the 3 Week Chart played out from that March 2024 high.
Bullishly, the turn down defined a low telegraphing another leg higher.
That new upleg carried into mid-July 2024 marking the one year cycle from the July 2023 peak.
The 3 Week Chart turned down again instigated by a Key Reversal Week from that mid-July 2024 peak.
The Flash Crash that followed the mid-July 2024 peak was defined by a gap down on week 4 on Monday, August 5th.
In other words the turn down in the 3 Week Chart marked the low + 1 day, Monday August 5th.
As Hit and Run members recall, we covered several SPY put positions on the open that Monday because of a Time/Price square-out.
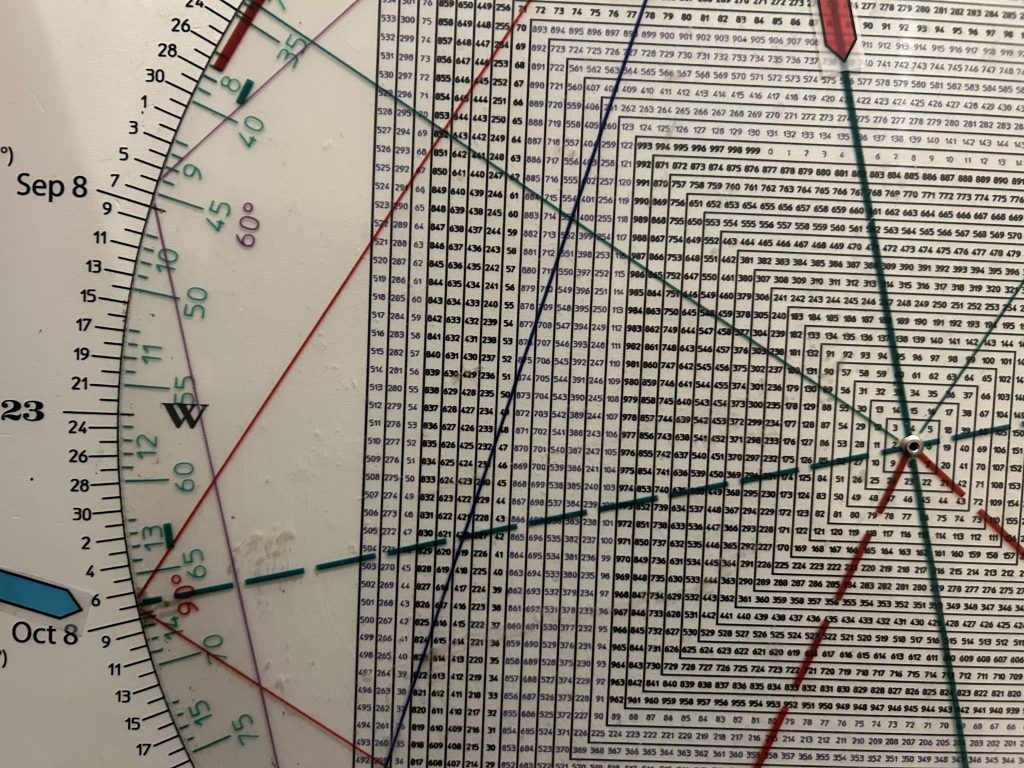
Let’s recap that square-out:
August 5 is 180 degrees straight across and opposite 508.
Pre-market on August 5, the SPY was trading at 508.
It opened at 511.64. the low for the day was 510.27 shortly after the open.
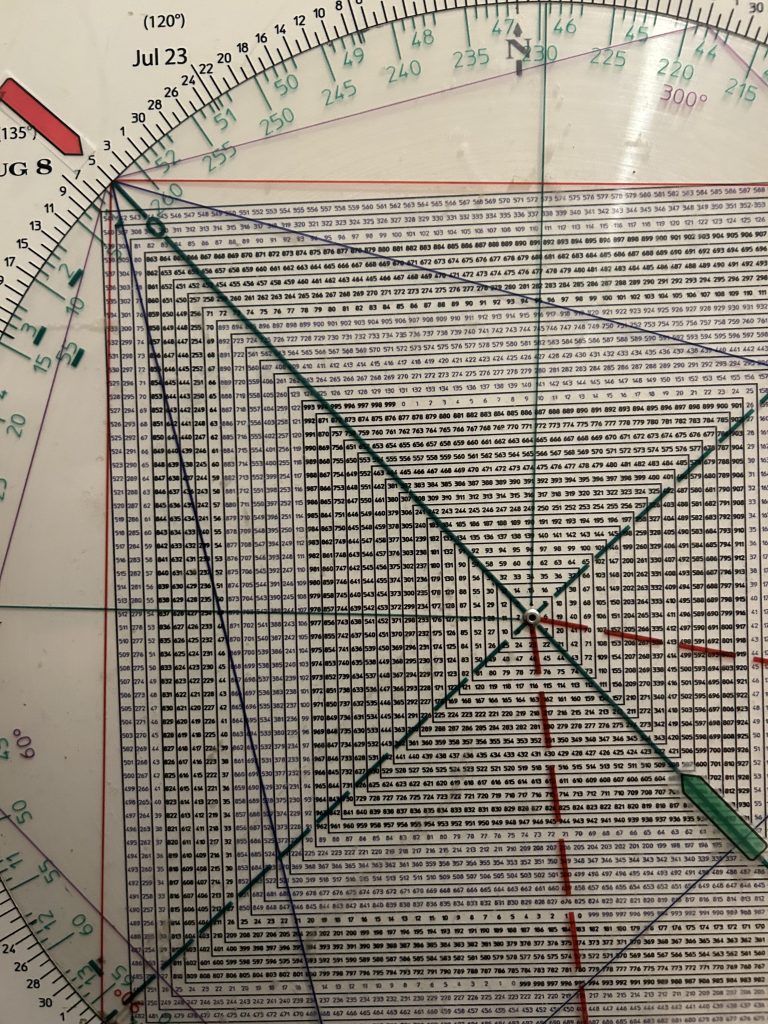
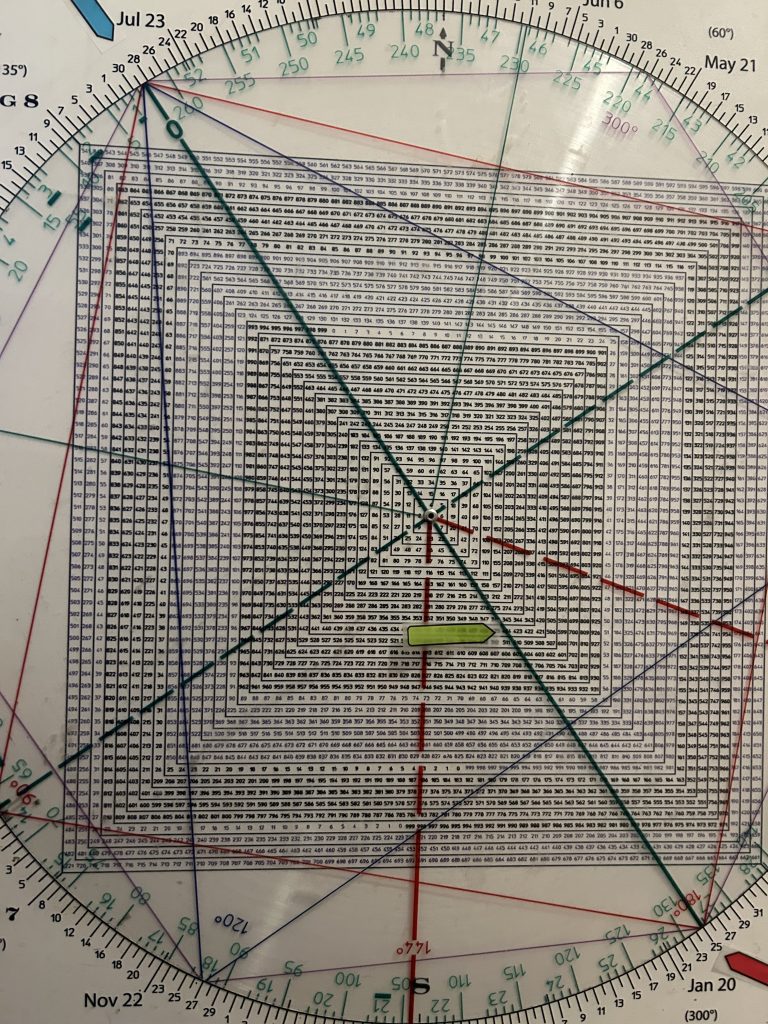
The Square of 9 Wheel did a stunning job of allowing us to lock in maximum profits on our puts.

Square of 9 Wheel
Purchase your own Square of 9 Wheel. Shipping to US only. Contact Jeff for shipping outside the US.
So essentially the turn down of the 3 Week Chart in late July/early August 2024 defined another important wash-out low.
In fact the SPX carved out a Stein and Handle pattern into the aforesaid early September low.
This pattern perpetuated the blow-off into Dec 6.
The 3 Week Chart turned down once again on the week of November 4.
Once again the turn down of the 3 Week Chart defined a low.
In fact from that low it exploded in a large range outside up week to a record high.
It was the Trump Pump.
The SPX went on to score a record high on December 6th, SEVEN weeks ago.
The 3 Week Chart remained pointing up until last Monday when it gapped down below the prior weeks low satisfying 3 consecutive lower weekly lows.
The drop also satisfied a 360 degree decline from the 6100 high.
360 degrees down from 6100 is 5791.
Monday, the 13th, the low was 5774 with a close at 6831.
You can’t make this stuff up.
The combination of the turn down in the 3 Week Chart a week ago Monday in tandem with 360 degrees down produced last weeks 241 point rally.
The 3 Day Chart turned up on Thursday.
Consequently Friday’s upside continuation following that turn up in the 3 Day Chart is constructive for the near turn bull case assuming the market holds up.
A turn down below Friday’s open gap and back below the 50 DMA leaves the SPX suspect.
A failure back below last Monday’s5774 low is a Get Out Of Dodge sell signal.
Once again, mirroring the aftermath of the election, the SPX exploded from a turn down in the 3 Week Chart nearly mimicking the election week’s outside up week.
The SPX exploded after turning its 3 Week Chart down prior to the election and then exploded to the top side.
Now the SPX turned its 3 Week Chart down last week and exploded prior to the inauguration.
Will this impulse lead to another record high that peters out similar to the November Trump Bump?
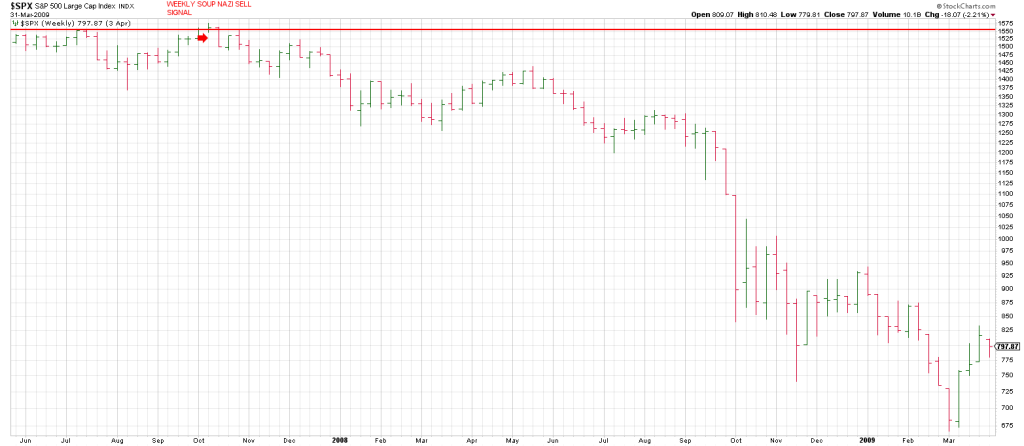
If we do get a new high above the Dec 5, 6100 high that knifes back below 6100 the same week, it will leave a weekly Bull Trap pattern I call a Soup Nazi sell setup…as in no soup for those chasing the momentum.
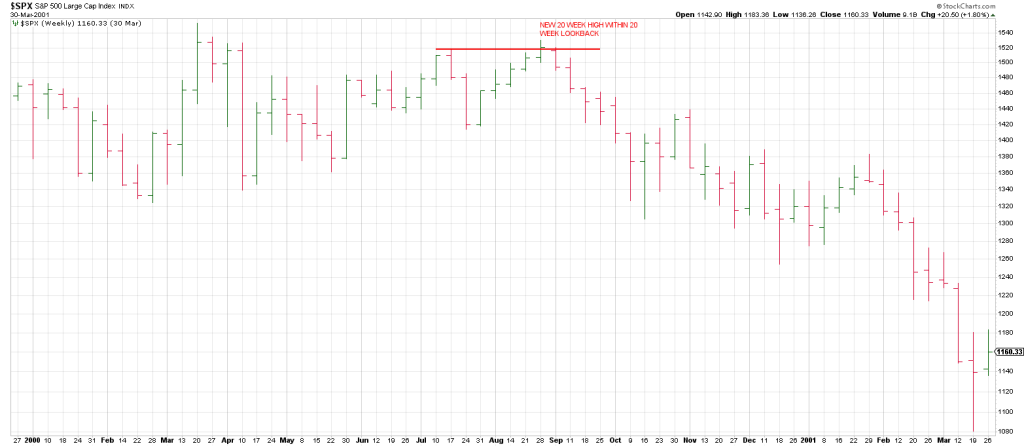
A weekly Soup Nazi sell signal a new 20 week high above the high within a 20 week lookback with at least a 4 bar (weeks) interval (opposite for Soup Nazi buy signals).
A Weekly Soup Nazi signaled the top in October 2007.
The SPX struck a new 20 week high on the week of August 28, 2000 and reversed the next week triggering a weekly Soup Nazi sell signal that led to a more than 2 year bear market.
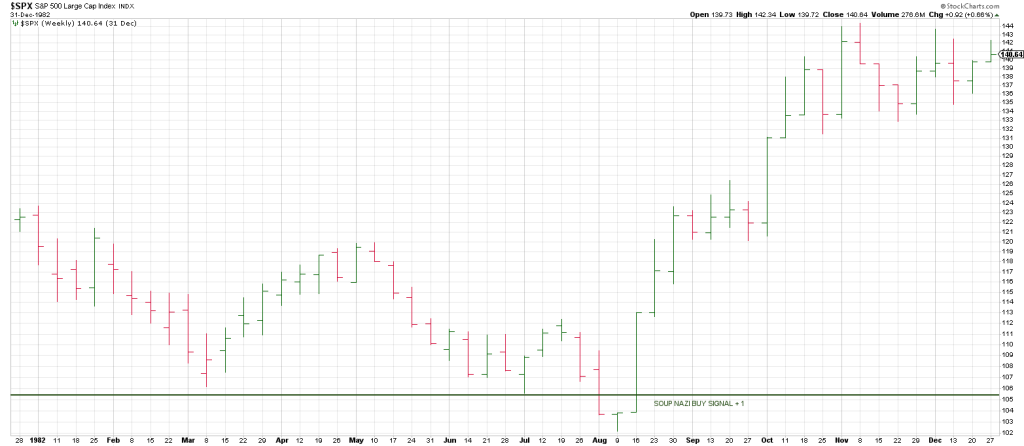
The low in 1982 was in the spirit of a Soup Nazi buy pattern.
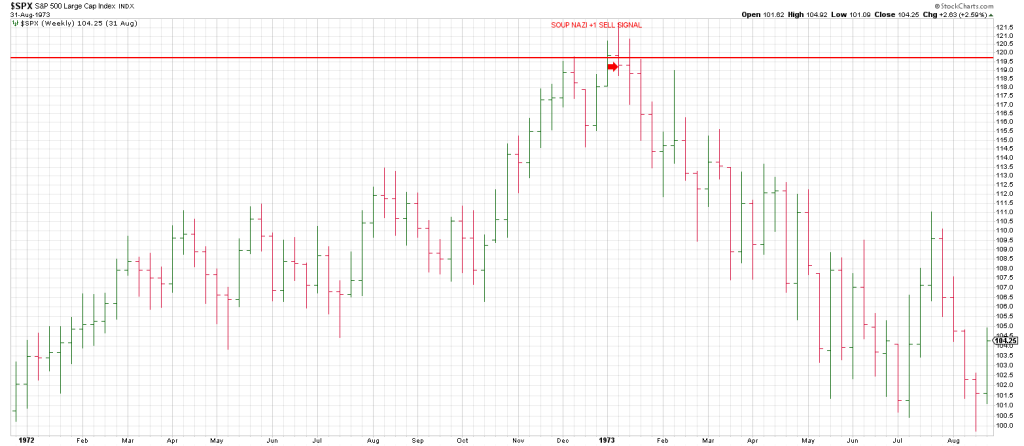
The DJIA bull market top in JANUARY 1973 left a Soup Nazi sell signal.
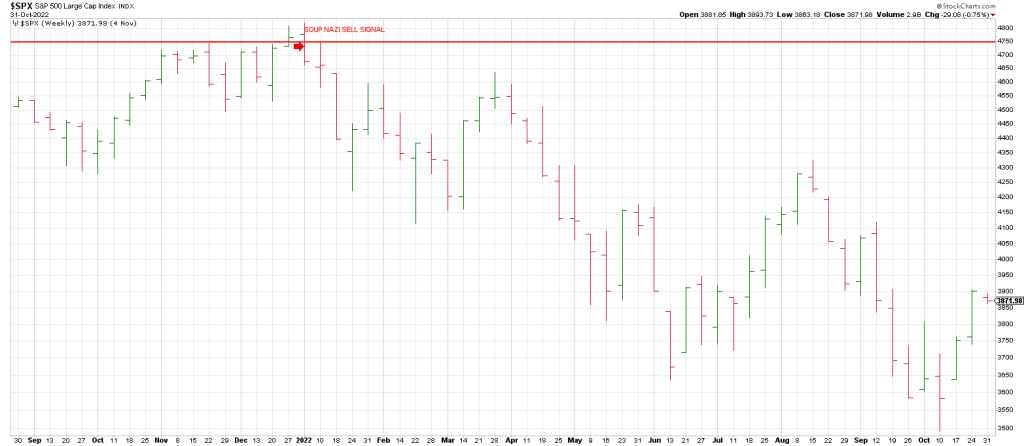
More recently, the SPX January 2022 top was defined by a Soup Nazi +1 sell signal
The last crash in the SPX was the Covid Crash that started from a Soup Nazi sell signal in February 2020.
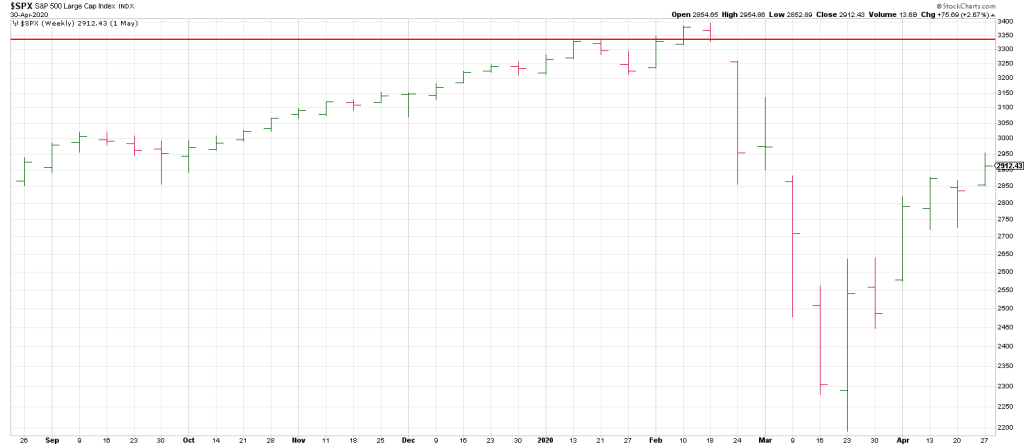
If we should get a new high on the SPX just above 6100 there are two reasons why I think it could echo the February 2020 peak.
1) A Measured Move from the 2020 crash low of 2192 to the Jan 2022 peak of 4818 has equality measuring from the October 2022 low 6118.
2) The SPX crash low in 2020 was 2192 (219)
5 revs of 360 degrees up from 219 is 615 or 6150.
[Image coming soon]
In sum, if the market does not begin to roll over with the Gann Panic Window this week, then this 7 week period from high could panic to be a new high, a Buying Climax. Be that as it may, new high or not this rally shapes up as a last hurrah. There are too many signs that the broad averages have topped, pointed to in this space, including breadth numbers that have turned ugly.
As flagged in this space for the last 6 months, cycles are due to exert their downside influence.
Even the Nikkei index finally exceeded its 1989 high last year, after 35 years.
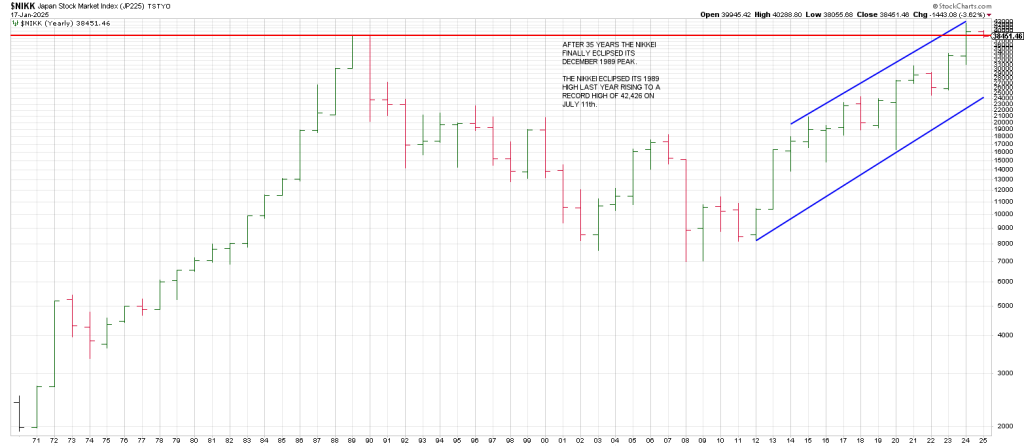
The Nikkei rose to 42,400 in July 2024 eclipsing its 39,000 high in December 1989.
The Square of 9 Wheel shows 424 (for 42,400) squared out with July and this week.
From its July high, on August 5th, the Nikkei saw its biggest one day drop since 1987.
The index dropped 12.4% to 31,458 from 35,910.
Does the Nikkei look like it’s at the beginning of an advance?
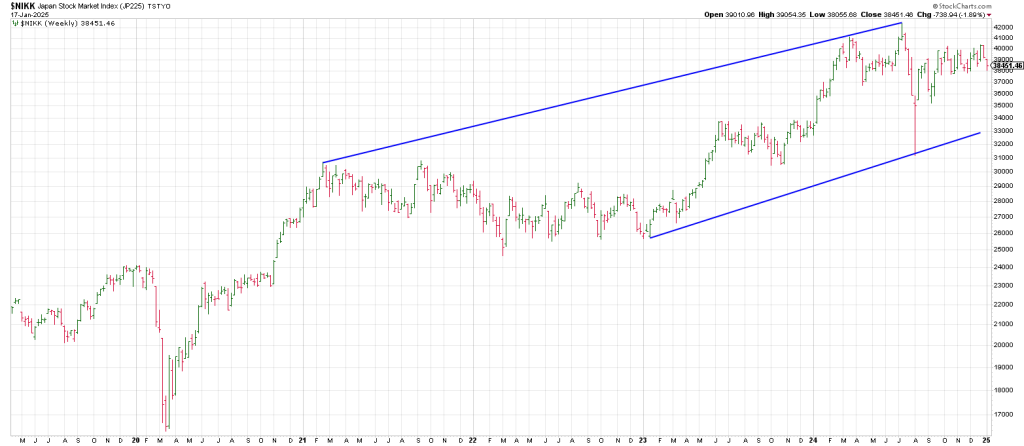
Notice the weekly Soup Nazi sell signal on the Nikkei in July just prior to the crash.
A new high here in the U.S. would get bulls bullish, setting the hook for a new crop of speculators who have never experienced a bear, let alone a take-no prisoners killer like the one that’s coming.
Tomorrow’s report will show how the Los Angeles fires are synchronous market-wise to the Great San Francisco Earthquake and fires in 1906.