“Wild thing, I think you move me
But I wanna know for sure.” Wild Thing, The Troggs/ Jimi Hendrix
The Flash Crash we forecast to start in late July saw the SPX spiral 450 points—
From 5565 to 5119 on August 4th.
Like all good roller coasters, the market has returned to where the slide started.
Friday’s high…5561.98.
Rollercoasters have specific names for their thrills:
A Helix is a spiral which can be upwards or downwards.
Yep.
A Horseshoe is a 180 turnaround maneuver with high banking with riders getting titled at a 90 degree angle.
Cycles suggest we could see a Horseshoe this week.
A Corkscrew resembles a Helix that rotates riders 360 degrees perpendicular to the track.
A Sidewinder is an inversion where riders enter a half-look followed by a half-Corkscrew and then exit the element perpendicular to the direction in which they entered.
So yeah we’ve been on a rollercoaster this summer.
And there are sure to be more wild twists and turns:
When volatility ramps it just doesn’t fade.
Remember Volmageddon in January 2018.
Volatility continued throughout the year finally climaxing with the Christmas Crash that year.
This week is set to be wild.
We had a line drive move to the downside to kickoff August.
Then a vertical shot to the topside.
This week my expectation is for two-way price action.
Here’s why.
The SPX has returned to the scene of the crime…where the Flash Crash started.
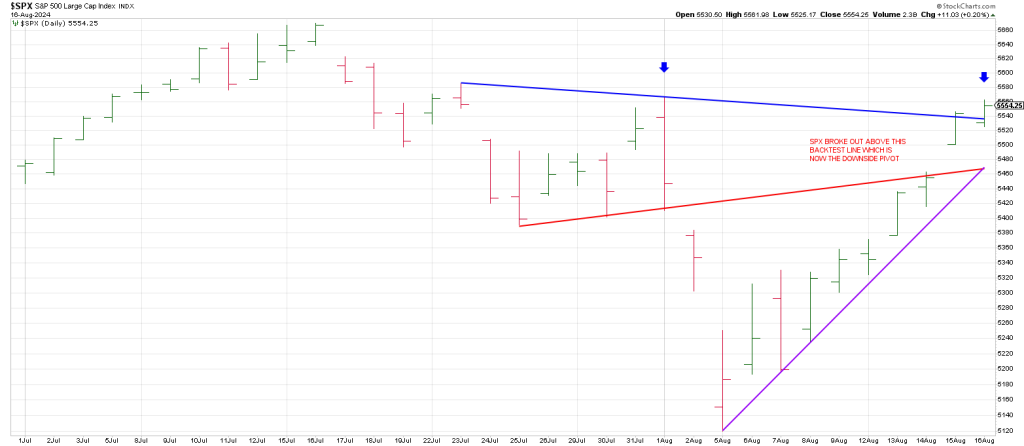
Trade this week above last weeks high puts the index in the WEEKLY Minus One/Plus Two Sell position.
This is because the 3 Week Chart is pointing down (Minus One —it turned down the week of July 29th.
Two consecutive higher weekly highs satisfies the “Plus Two” part of my Swing Method.
That does NOT mean the index is an automatic sell.
That’s why I say it’s “in the position”.
When the weeklies are in this position you want to watch the hourlies and dailies for a sign of a reversal.
Notice the downside pivot is an intersection of two trend lines in the 5465 region.
I would not be surprised to see a test toward this 5465 region followed by a rebound to test current levels. If I am correct both moves could play out quickly.
As flagged last week 554 (5540) squares-out with August 5th, the low day.
We are a tad above 5540, but a reversal back below this level that sticks opens the down door.
180 degrees down from high is 5520 so this ties to the aforesaid square-out at 5540.
Today is also a full moon.
The stock market often has a strong lunar connection when emotions are running high for investors.
When there has been market volatility and or geopolitical tensions and or financial disintermediation (Yen Carry), the moon can be a very strong predictor for how investors will behave and thus how they will move the markets.
When there is an unprecedented amount of fear/greed and uncertainty this phenomenon has worked very well.
Sometimes the markets are earnings-driven, sometimes they’re interest rate-driven, and sometimes they’re emotionally driven.
The market has been very emotional this month. The price structure is setup to be affected.
While lunar cycles show up regularly, they don’t always affect markets but when markets are whipping around and are highly emotional,
Non-rational indicators start to show up in the price structure.
Let’s take a look at 1987 and 1929.
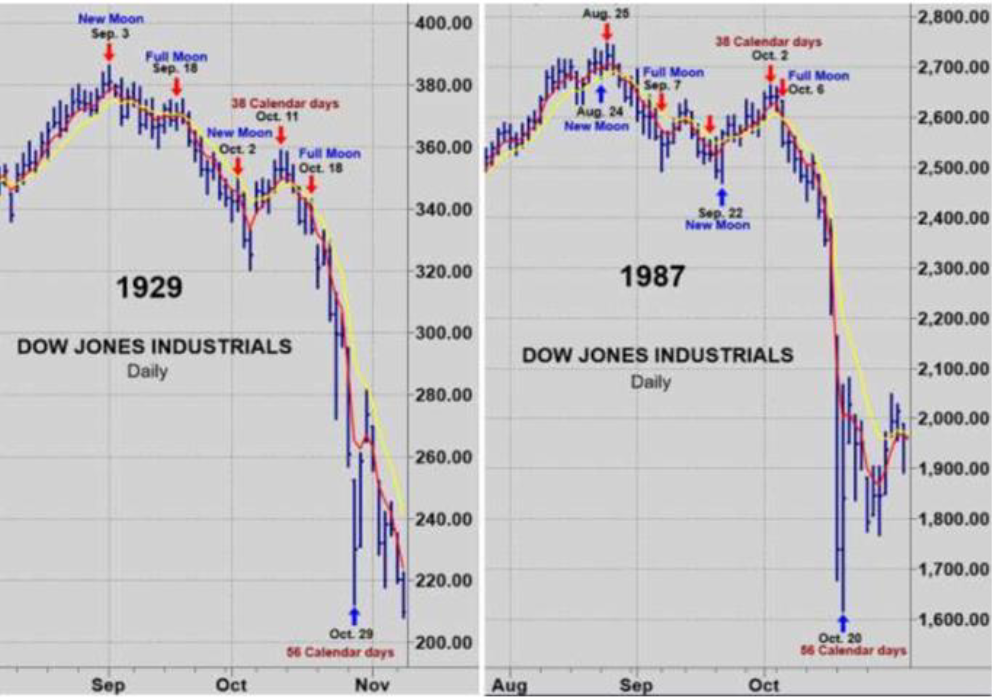
In both instances the secondary rally ended near the full moon.
In 1929 the DJIA was the heart and soul of speculation.
Today it’s the NDX/QQQ.
The pattern in the Q’s is remarkably similar to the DJIA following the September 3, 1929 top.
In the spring, I suggested the possibility that the SPX may be working on a mirror image foldback to 1929.
In other words rather than a blow-off into early September, a rug-pull in early September.
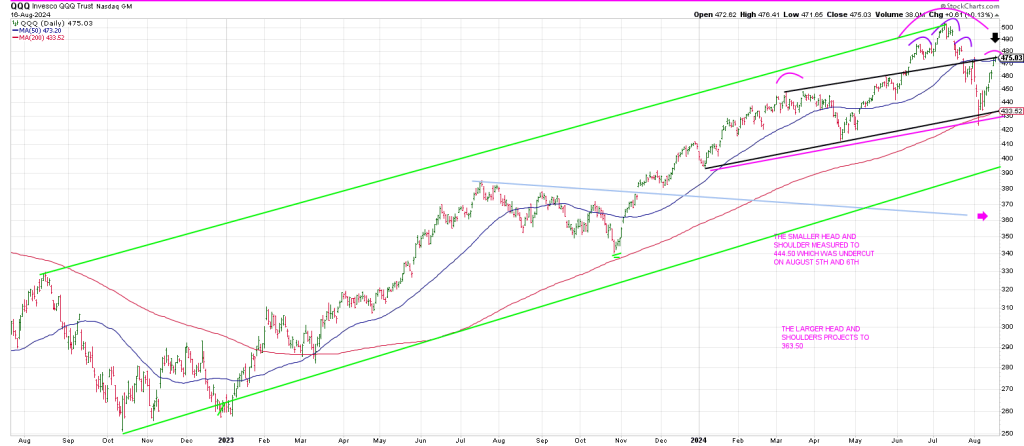
The Q’s carved out a small Head & Shoulders top at the highs which measured to 444.40.
That level was undercut on August 5th and 6th.
Notice how the Q’s kissed the 200 day moving average on August 5th leaving a signal bar reversal.
A Gilligan’s Island: a gap down to a new 60 day low with a close near session highs.
This was the first full test of the 200 day ma since March 2023.
October 2023 just missed.
Does the Jackknife off the 200 day moving average exemplify Buy The Dip or is it a massive stick save underscoring just how serious the financial issues were/are?
The larger Head and Shoulders projects to 363.50.
The Neckline is the 433 region which ties to the recent lows.
Whether the Q’s are tracing out a B Wave to be followed by a vicious C Wave decline or a corrective Wave 2 is academic.
If August 5th low is violated the Bear is on the prowl.
Notice that the bottom rail of a trend channel from last October resides at the 395 region.
Breakage below 395 opens the door to a potential quick drop to 363.
Notice how 363 is a backtest of a Ghost Line (light blue) from the 1 year ago.
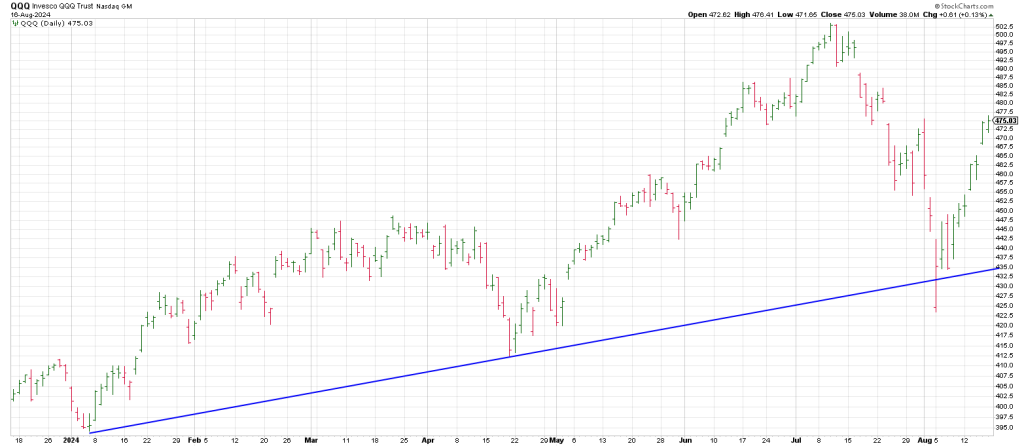
A QQQ trend line for 2024 also shows the significance of the August 5th low.
The Q’s rebounded off this trend line producing a 3 point trend line for the year.
Breakage below 435 is unlikely to be the test Wall Street will be calling it if we get there.
A DJIA from 1929 shows the Get Out Of Dodge sell signal produced when the DJIA broke a trend line for the year.
This is not a place where the bulls want to see a stall out.
I think we will know within the week what the scenario is.
Gold exploded to a record high on Friday coming out of a 4 month Bull Flag.
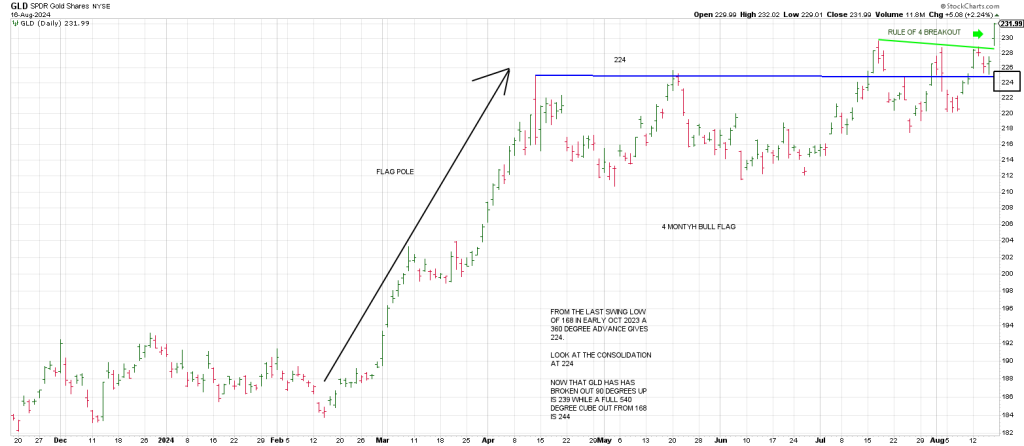
GLD exploded 5 points to 232 after triggering a little Rule of 4 Breakout on a gap.
It conspicuously left the 224 region.
From the last swing low of 168 in early October 2023 a 360 degree advance gives 224.
We left that behind on the weekly closing basis.
Now that gold had broken out, 90 degrees up is 239 while a full 540 degree cube-out from 168 is 244.
This week points to/vibrates off 238 and squares-out 244.
Pulling back the lens to check the monthlies we see that GLD closed above a 4 year channel on Friday (dark green channel).
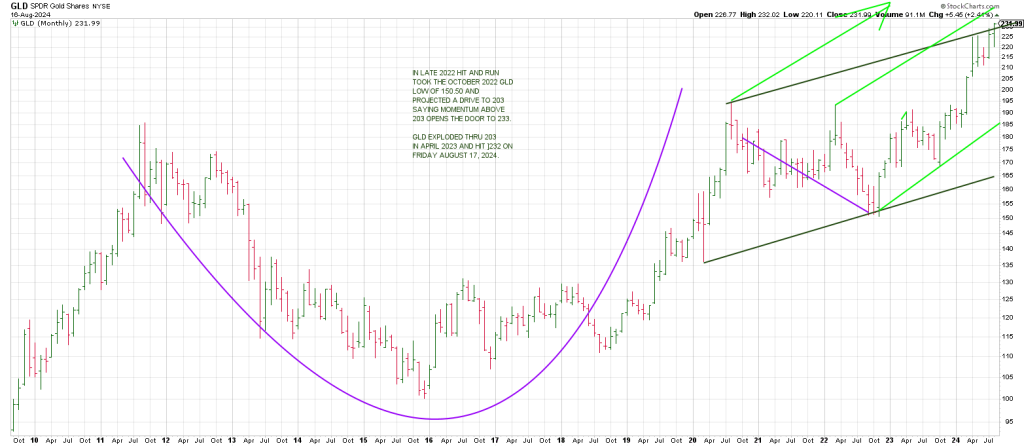
A shorter channel (light green) projects to the 244 region.
Notice that the entire acceleration from October 2023 follows the Handle of a massive Cup and Handle.
Gold has a tendency to strike important highs in August/September…2011 and 2020.
A spike this fall could see an interim top but one that is within the context of higher levels over the next year.