“But I suppose no one knows
You’re my plastic fantastic” Plastic Fantastic Lover, Jefferson Airplane
“That which is not but ought to be is more real than that which merely is.” Zoe Lund
Retail investors bought a record $40 billion of U.S. Equities in April.
This is $10 billion more than the previous all-time high recorded at the beginning of the 2022 bear market.
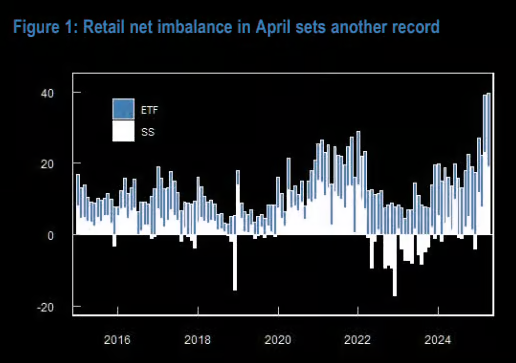
Institutions sold or sat on their hands.
Why the rush into stocks? Many retail investors have never been through a true bear cycle.
Since 2009 the market has always “come back”.
Clearly retail investors have learned how to recognize a buying opportunity.
In sum, when this money floods into EFT’s it must be deployed automatically into stocks.
It’s a passive plastic response.
Active management has dwindled. ETF’s rule the roost.
This is why offers were taken promiscuously last month producing a 20 year record win streak.
In the quietest session of the past week, the SPX broke its win streak in a down up down session leaving a possible hourly Head and Shoulders for the May price action.
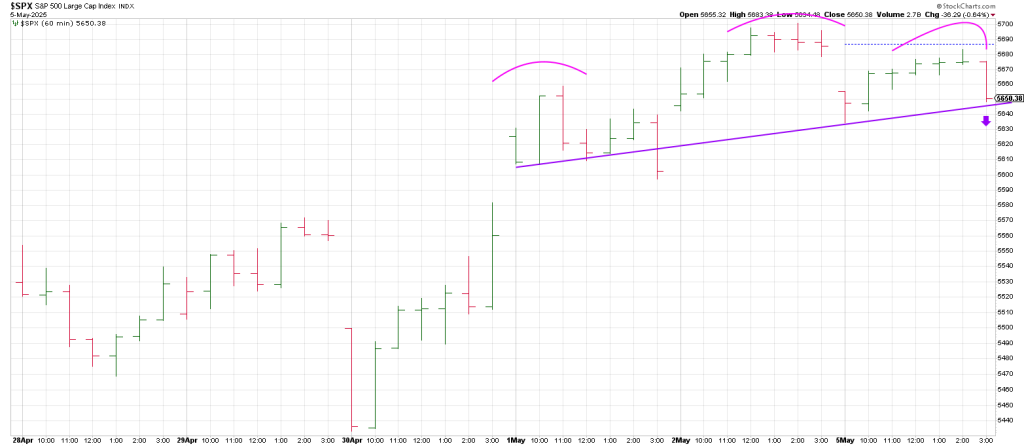
The SPX gapped down rallied to Phil D Gap and rolled over in the last hour.
Breadth deteriorated significantly, with net declines of 914 on the NYSE and 1,399 on the NAZ.
The McClellan Oscillators dropped sharply, especially on the NAZ as Mag 7 names are coming under renewed selling pressure.
W D Gann was a big fan of using the moon as a timepiece in many ways.
For example applying the sidereal cycle of the moon (from the viewpoint of the sun) pointed to April 9th.
The next cycle is expected to be May 7-8.
Wednesday is May 7th.
As offered on the twitter feed, if we hold up/rally into the 7th, my expectation the market gets punished.
If we pullback sharply into May 7th, my expectation is the market rallies into Friday.
We called the summer highs of 5650-5660 the Maginot Line.
Checking the Sq of 9 shows that 566 (5660) is 180 degrees straight across and opposite 615 (6147) the all-time high.
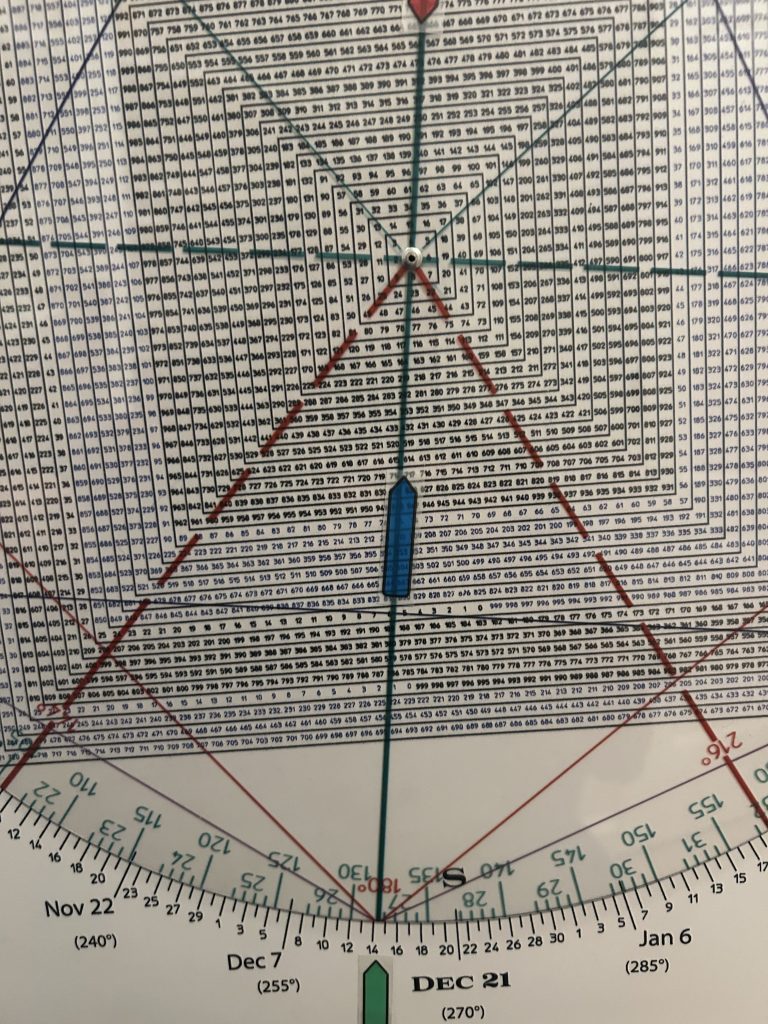
Notice that these numbers are on the axis that ties to mid-December and mid-June.
Last week we suggested that mid-December may have set the orthodox high, the Primary High with the SPX carving out a Test of a Test Failure pattern into February.
December, Primary High
January Test of Dec high
Feb Test Failure of the Jan high.
The SPX closed above 5660 once, last Friday, the high for this rally.
Monday it closed right on 5650.
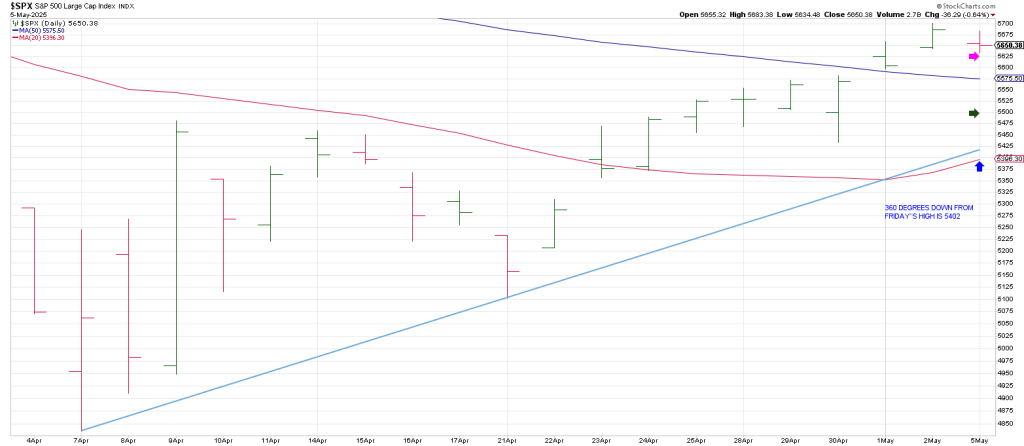
Downside follow thru from this Maginot Line opens the door to 90* down at 5625.
Below that 180 * down ties to 5550.
A full 360 degree decline is 5402 which is a Bottoms Line from April 9th.
Roadmap for Tuesday May 6
A Trend Day down into 1:00
a Snapback from 1:00 into 2:00
followed by a drop into 3:30 (that is projected to take out the 1:00 lows)
A sharp Snapback on the runoff—from 3:30 into the bell