“Stocks don’t move, they are moved.” Jack Cooper
First, I want to clarify the Time/Price square-out in this region.
It is actually 596 (5960), not 594 (5940).
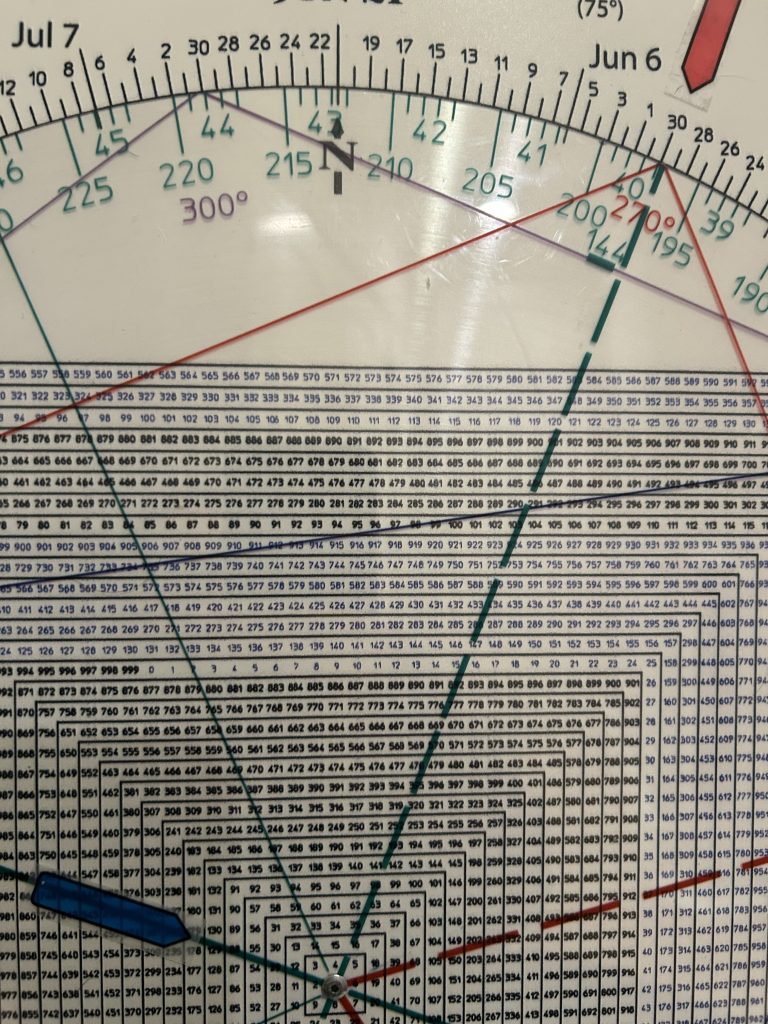
The Square of 9 image below shows that anchoring ‘0’ to the high day Feb 19 aligns with 596.
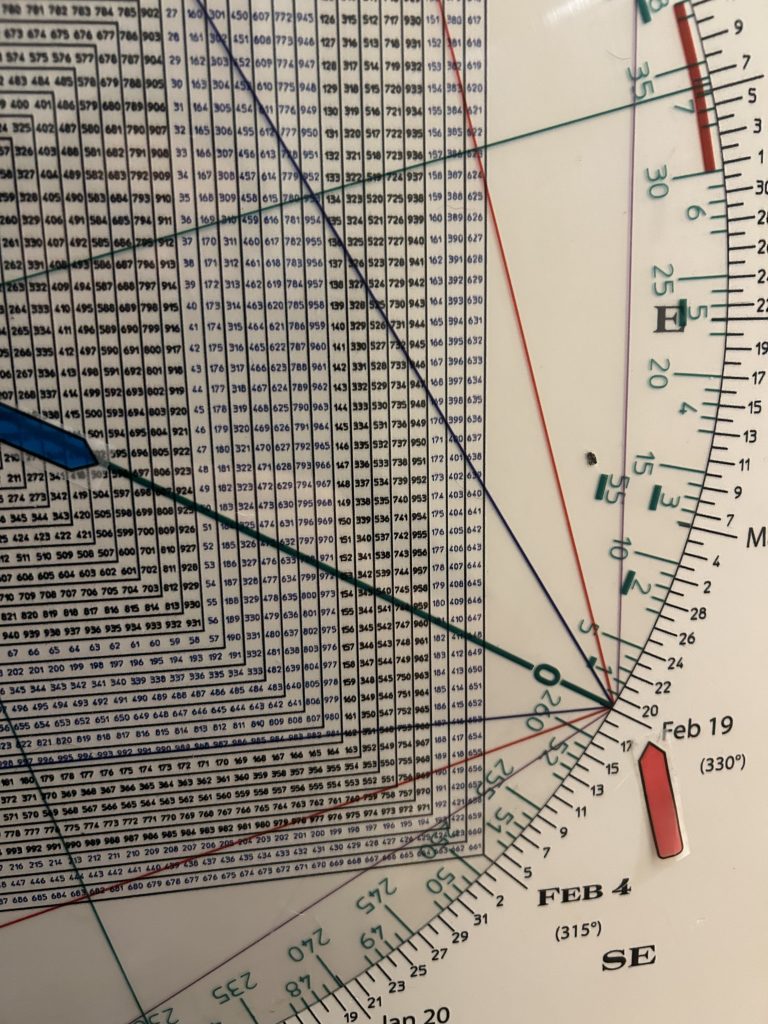
In turn, Feb 19 and 596 square-out with May 19 to May 21st.
The high day for the move off the April 7 low is 5968 (596) perfecting a Time/Price square-out.
Please go back and read the recent article Gann’s Master Time Factor and you will see how this is not happenstance but natural order.
What is interesting is that 5940 (594) squares out with the end of May.
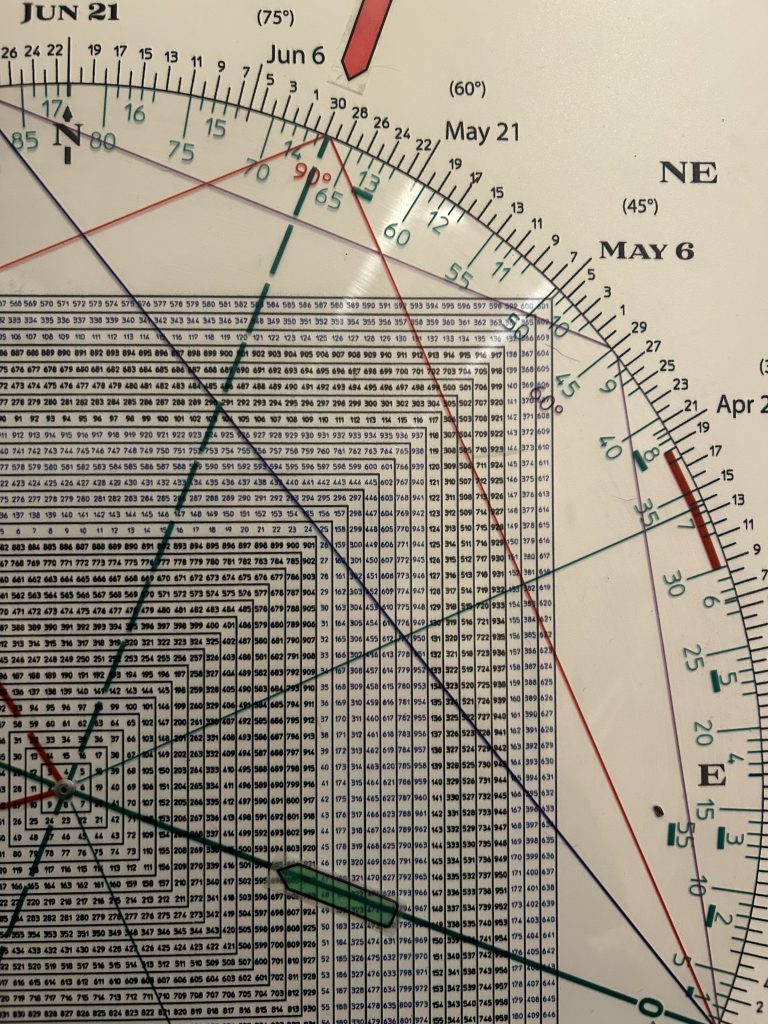
despite Thursdays premarket 100 point surge on the futures, the SPX opened on the high for the day at 5939.96. Basically 5940 in synch with the end of May.
The SPX has been going sideways, running in place, since the May 19 square-out.
Following that May 19th peak, the index pulled back sharply to test its 200 day moving average at 5773…essentially a 200 point down-draft in 4 sessions that turned the important SPX 3 Day Chart down.
Coupled with the test of the 200 day ma the turn down of the 3 Day Chart defined a low.
The normal expectation following the first test of the 200 day moving average following a vertical move that reclaims the 200 dma, is for a rebound.
That’s the juncture we’re at and the question we face going into June: are the last two weeks merely a rebound and a test of the May 19 square-out high?
Or, alternatively, has the SPX traced out a high level consolidation prior to launching a new impulse higher?
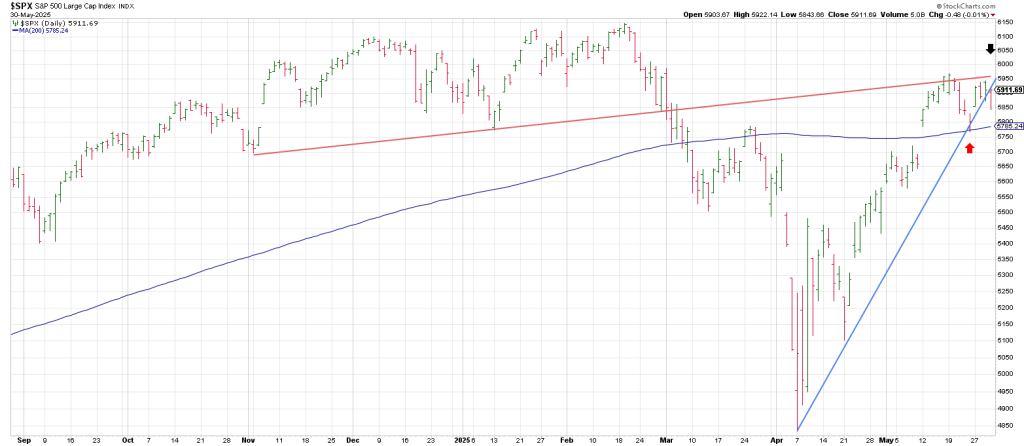
Notice how the May high backtested a Ghost Line from the November 2024 low and the January 2025 low.
At the same time it is testing a 3 point trendline from the April 7 low.
That trend line was violated on Friday but a violent backtest played out.
Was it courtesy of month end and options expiration?
A failure below Fridays low opens the door to a test of May 23 low and the 200 dma… a Come To Jesus Moment
For the bulls.
It is clear that market participants have been buying every recent Headline dip.
Friday was no different. The break on the news that China was cheating on the ‘tariff’ agreement saw a stunning 3 hour 80 point rebound in the SPX.
How do you play that kind of Whiplash?
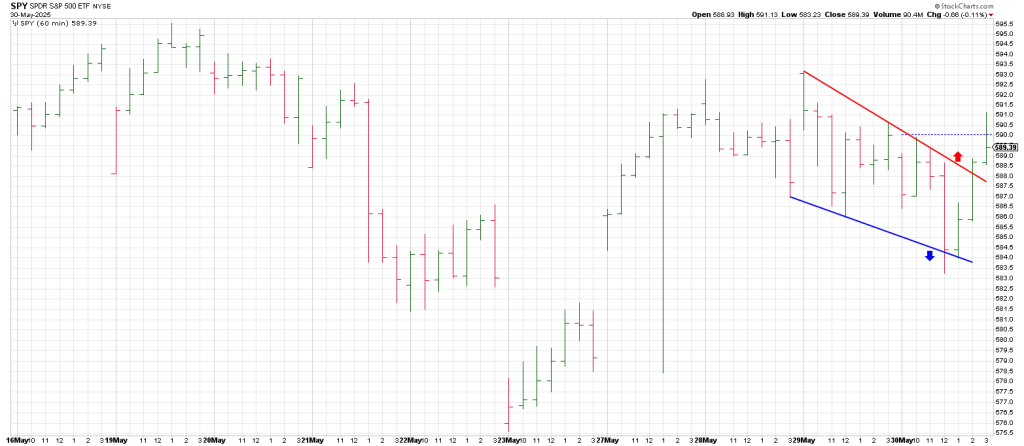
An hourly SPY shows an Undercut and Rally pattern.
The SPY broke well defined support but quickly recaptured it suggesting there was an agenda.
It was a Trap Door that catapulted the SPY over the top of well-defined hourly resistance.
Was Friday an OpEx Pinball and month end shenanigans from 585 to 590 SPY or the real deal—a precursor to a leg higher.
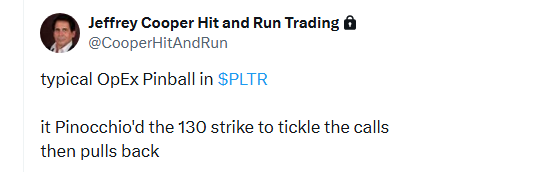
PLTR was the poster child for Friday’s OpEx Pinball.
Early Friday on the Hit and Run Private Twitter Feed we flagged that PLTR was a Tractor Beam to the 130 strike.
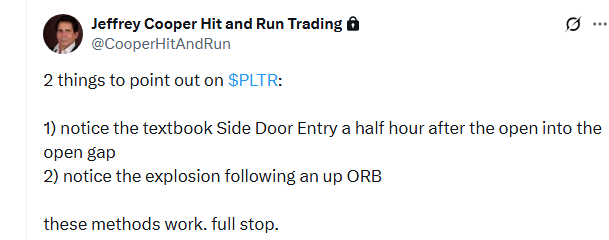
After PLTR spiked over 130 it collapsed all the way back to tickle the 125 strike.
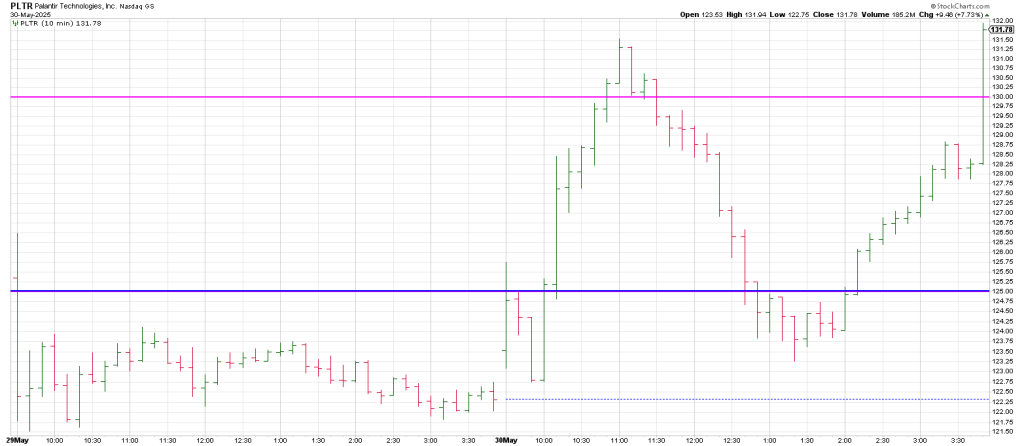
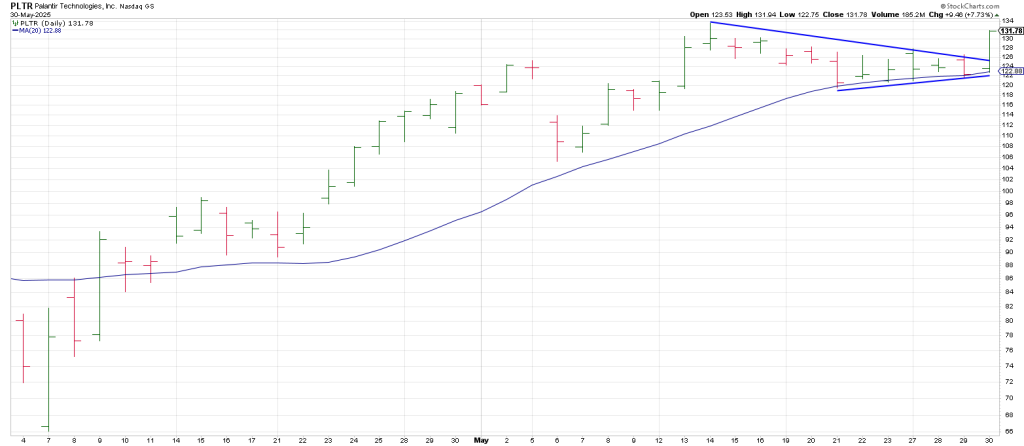
In sum, PLTR broke out of a triangle on trade over the 125 strike on an option expiration.
Isn’t that special.
How much were the 125 calls on Thursday with the stock closing at 122?
With PLTR closing at a new record high and a possible Time/Price square-out, the risk is a reversal thru the bottom of the triangle producing a Triangle Pendulum sell signal.
False moves come from fast moves and breakage through the bottom of its triangle and the 20 day moving average would likely produce an equally dramatic drop.
Above we looked at the SPX/SPY square-outs in this time/price region.
Let’s take a look at how they shape up measuring from the April 7 low of 4835 (483).
First, April 7 squares-out with 349 (3490). This is the October 13, 2022 major low.
This square-out alone underpinned the likelihood that plunge to April 7th could be an important low.
It was.
483 squares out with 575 (5750) and 599 (5990). The SPX pullback low from the May high was 5760).
Thursday’s opening spike on the SPY kissed 599 pre-market.
In sum, what happens over the next two weeks is likely to decide whether the last two weeks have carved out B Wave top prior to a vicious C Wave decline or a high level consolidation to a new upleg.
Why the next two weeks?
The momentum peak played out from December 6 thru December 16.
180 days/degrees forward is June 6 to mid-June.
Notice that 90 degrees from Dec 6-15 ties to mid-March pivot low.
A drop below the recent SPX 3 Day chart low on May 23 at 5768 and the 200 day moving average warrants caution.
The April 2024 low flushed the bottom of a trend line connecting the October 2022 low and the October 2023 low.
This is a good line as it parallels a Tops Line connecting the July 2022 peak and the December 2024 Momentum Peak.
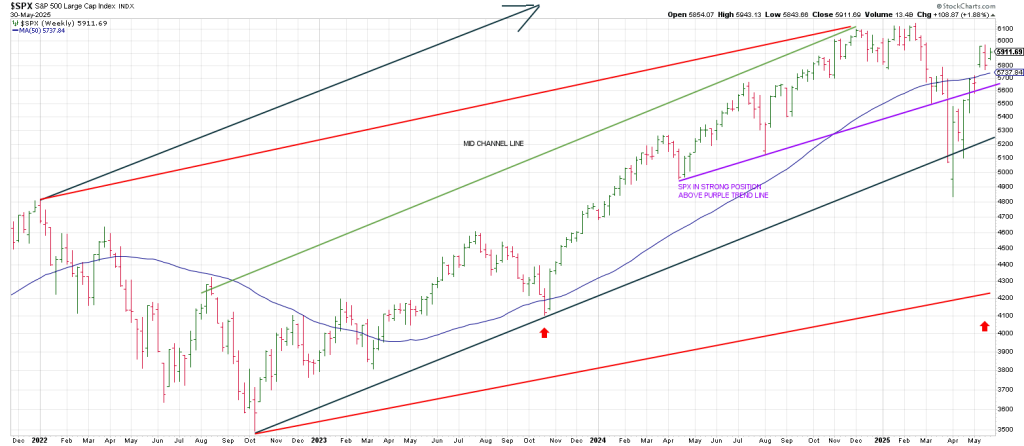
I also paralleled a line off the January 2022 high.
Theoretically a new leg could project into the 7.000 SPX region. Theoretically.
The point is the light green line defines a mid-channel line.
The upper red Tops Line connects the January 2022 top with the December 2024 Momentum Peak.
I paralleled a Bottoms Line from the October 2022 low.
Breakage below the 5250 level, the bottom rail of the green trend channel, opens the door to the 4200 region.
I also drew a trend line (purple) connecting the April 2024 low with the August 2024 low and the March 2025 low.
The SPX water-falled when it broke but the index put itself in a strong position recapturing this purple trend line, but breakage back below it could see the second mouse get the bear cheese in a big way.