In the lightest trading volume since the SPX Feb 19 all-time high, markets staged a solid counter-trend rally.
The DJIA gained 383 points while the SPX rose 60 points.
Breadth was positive with net advances totaling 1,192 on the NYSE and 1,9 on the NAZ.
The SPX rally from the March 13 low of 5500 to Wednesday’s high of 5715 reclaimed 215 points marking a 33.1% retrace of the decline from the Feb peak.
Historically counter-trend rallies in a declining market tend to recover around 50 of the prior drop.
However, some turn down at around 32% and some extend as far as 68% before the primary downtrend resumes.
The challenge is that one can never know precisely when that reversal will occur.
Given the powerful downside momentum we’ve seen since the Feb 19 peak, the next downturn will likely be sudden potentially opening with a sharp overnight gap down.
The Gann Panic Window argued for having exposure in index puts, but as noted in yesterday’s report, it was becoming increasingly likely that the count should be measured from the February high rather than the January 24th orthodox high.
Being flat puts if the primary trend is down in this panic window risked being caught flat-footed, and forced to chase the move just as uncertainty about the trend re-emerges.
Jesse Livermore discusses the conundrum of navigating counter-trend rallies in Reminiscences of a Stock Operator, but we’ll save that for another time.
It was an odd FOMC Cha Cha Cha Day.
With 50 minutes to go before the bell, it looked as if the “third Cha” would be MIA.
However at 3:10 (ET) the SPX turned tail following a spike to 5715 dropping 43 points in 20 minutes.
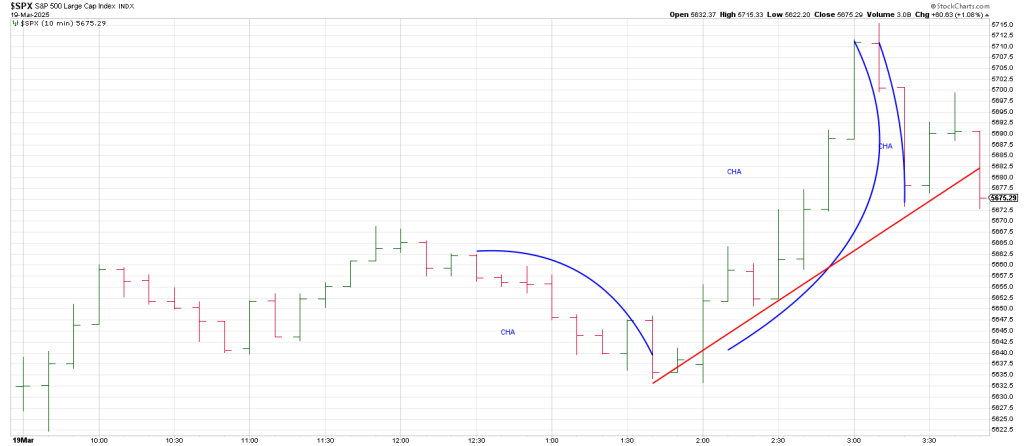
It looks like the SPX knows this region. And it should. 5706 is 720 degrees or two full revs of 360 degrees up from the August low.
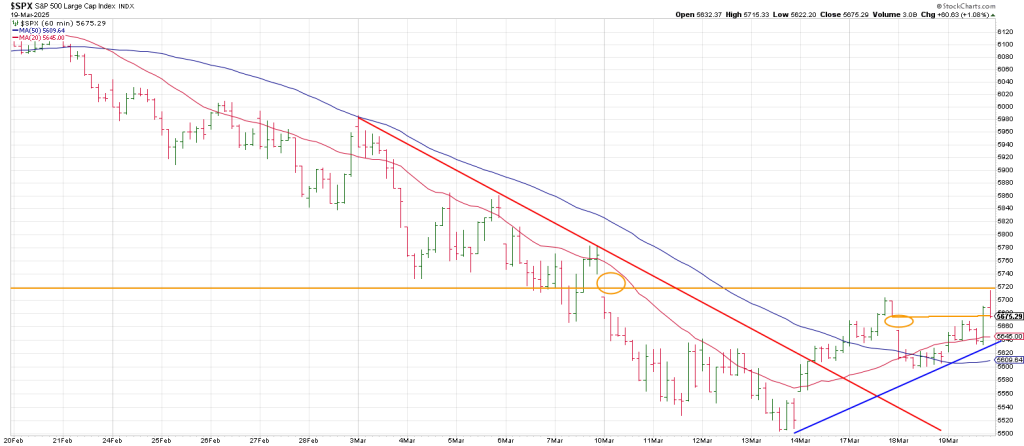
An hourly SPX shows yesterday’s rally took care of business meetings with Phil D Gap.
It filled a gap from Tuesday, 3/18 as well as from March 10th.
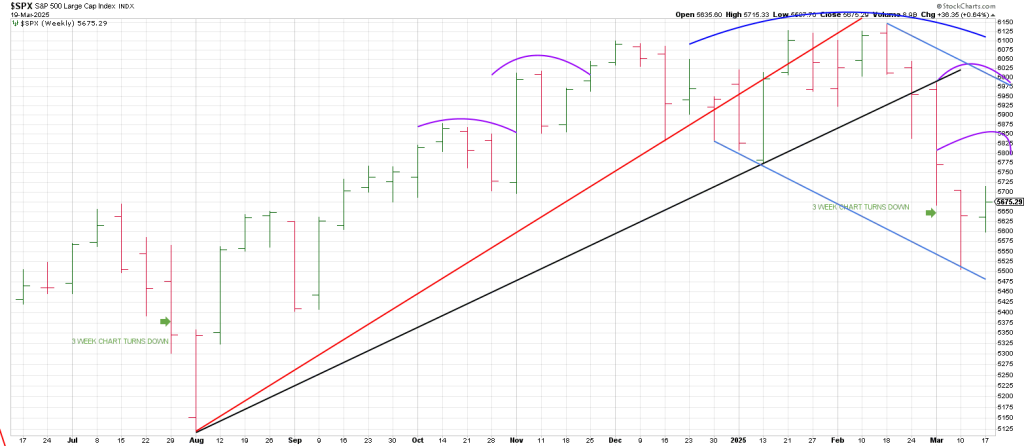
As well, the SPX Weekly Swing Chart turned up yesterday.
In a sharp down turn such as we’ve seen where the index turns its 3 Week Chart down, the normal expectation is for a upside reaction.
The normal expectation is for the Weekly Swing Chart to turn back up.
It did so yesterday.
This should define a pivot high soon in terms of time and price.
Upside resistance is well defined at this region.
In sum, the last time the 3 Week Chart turned down was in late July/early August.
It skidded lower the next week on the morning of August 5th where a blow-off culminated 6 months later.
The route the SPX takes from here will be telling. If a top is in we should rollover sooner than later taking out last weeks low. Doing so will issue a Time Turn Trend sell signal.
This is because the 3 Week Chart integrates the behavior of price within TIME.
Alternatively if the SPX pushes higher especially above the 5825 region which marks a 50% retrace of the decline off the all-time high, then theoretically the market can squeeze to one more new high.
I’ll believe it when I see it.
Notice that 5825 could satisfy the right shoulder of a weekly Tombstone Top.
Above 5825 region something else is going on.