Even before Monday’s mid-session dive, the VIX was strong.
It ended up spiking 12% signaling increased investor concern.
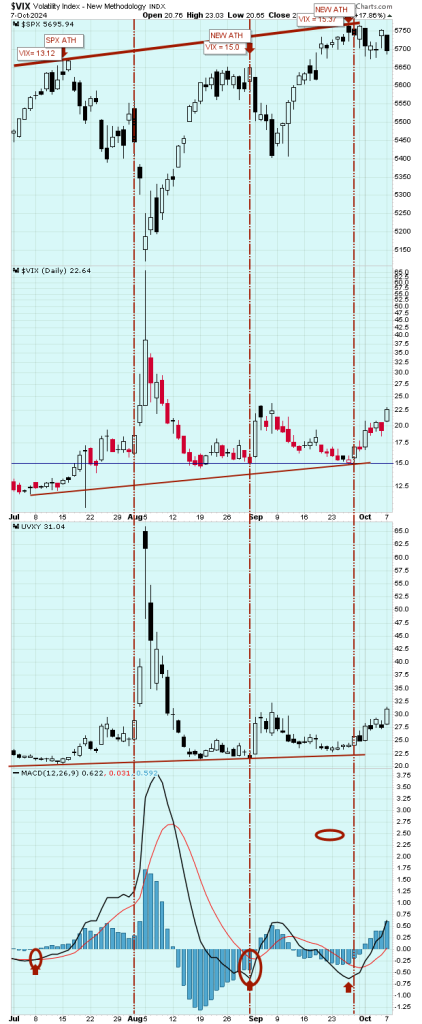
Notice that at each successive peak in the market since July, the VIX struck a higher high.
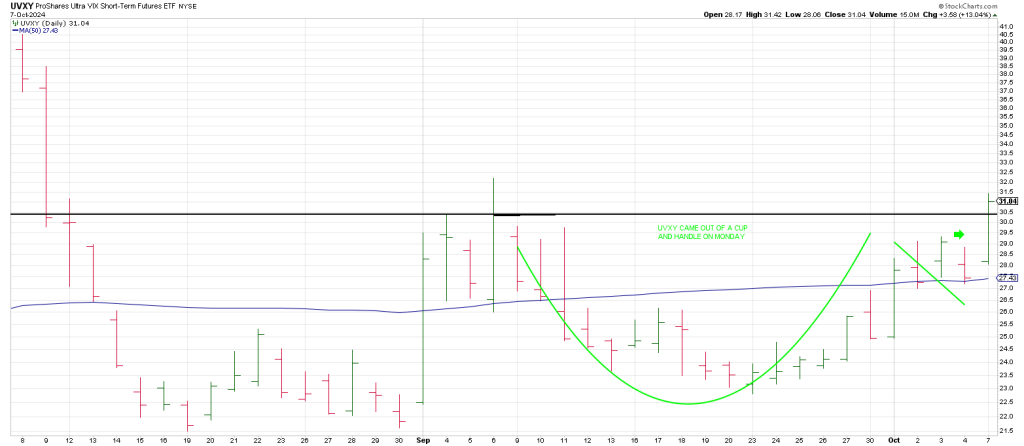
Early in the session we flagged a Cup and Handle in UVXY, a VIX derivative.
UVXY ‘came out’ yesterday.
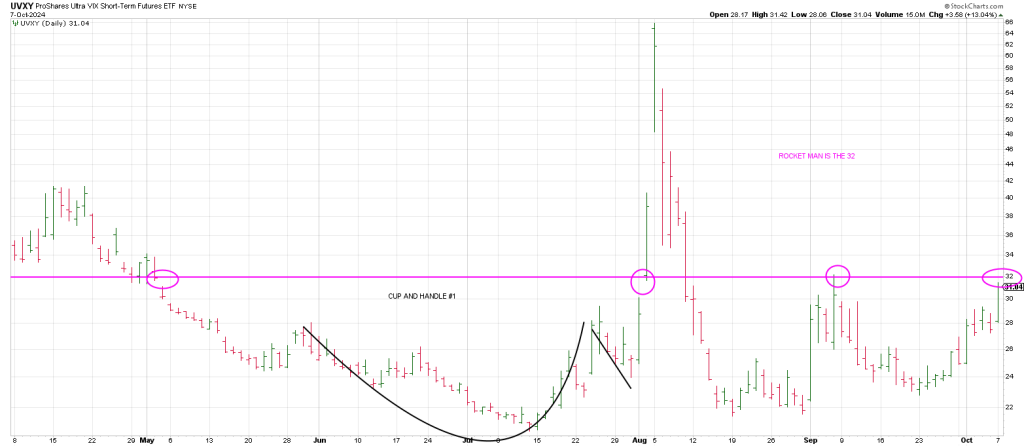
Pulling the lens back shows 32 is ‘Rocket Man’.
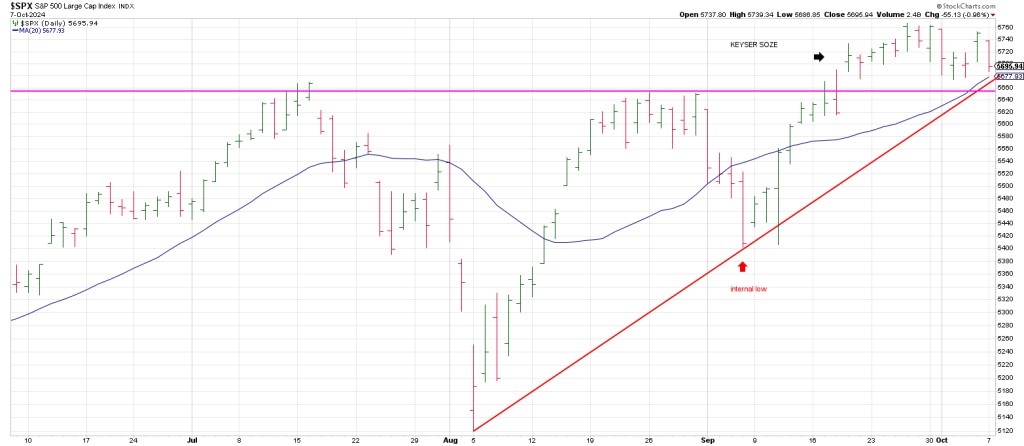
Monday’s decline accelerated when the SPX snapped a 20/50 hourly Bowtie as flagged on the private twitter feed.
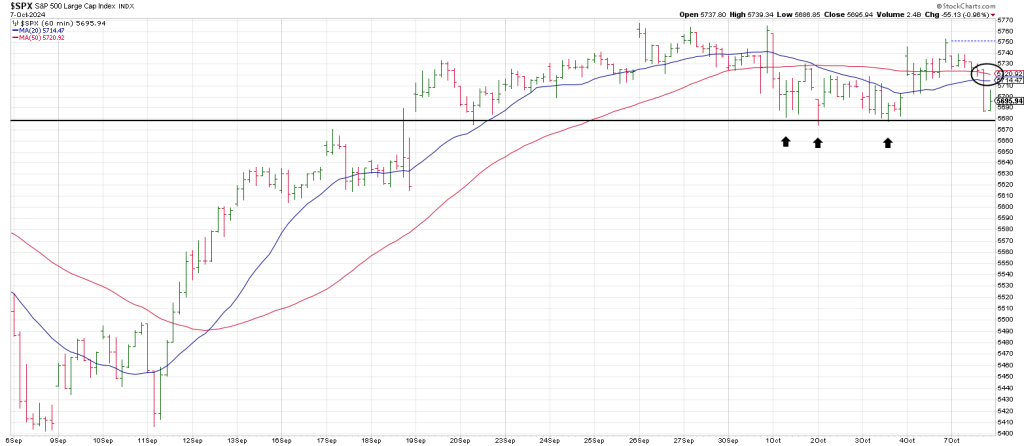
The close left the index hanging by a thread above little triple hourly bottoms at the 5680 region.
Breakage below 5680 produces a test of the summer peaks: 5669 on July 16th and 5661 in late August.
The Bull/Bear Pivot is locked and loaded.
The SPX 20 week moving average at 5678 is coincident with the summer peaks.
In addition a Bottoms Line from the August/September lows ties to this same region.
In addition, the SPX 3 Day Chart is 5674 from last Wednesday.
Follow thru below the 3 Day Chart low warrants caution.
In sum, it looks like the bulls have been unable to capitalize on the Keyser Soze attack the day after the Fed cut rates.
To recap, on September 18th, the Fed cut rates 50 bps and the market reversed leaving an outside down day.
The next day the market gaped open carving out a Keyser Soze, a Reversal of a Reversal that left the bears wrong footed.
However, the bulls have been unable to build on the move.
What looked like a high level consolidation is threatening to roll over.
The market has been unable to capitalize on Jerry’s Pivot.
Yields have only risen since the Fed cut rates.
The 3 Week Chart on TNX turned up last week with a flourish in a large range outside up bar.
Yesterday 10 year yields challenged their overhead 20 week moving average making a 3 month high.
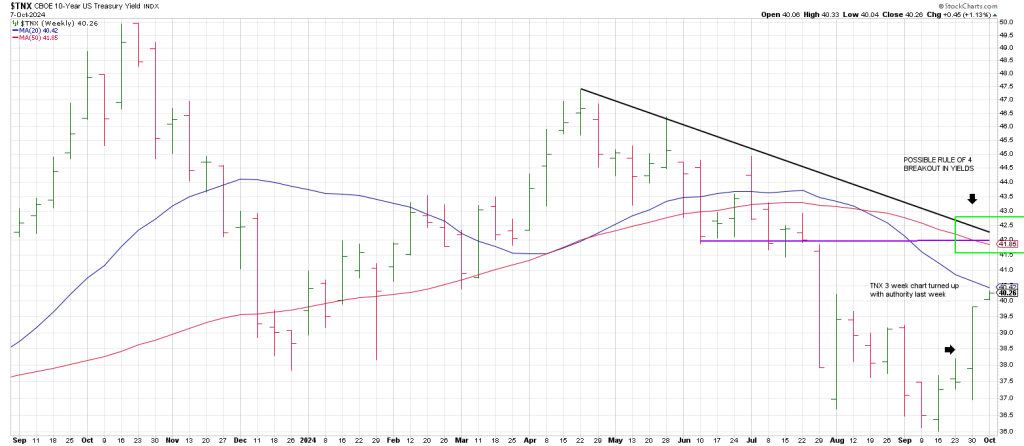
If the 10 year yield can crack 4% it can push to its 50 week moving average at 4.18.
How quick that occurs could tip the SPX over below its 20 week moving average.
Yesterday on the private twitter feed we fleshed out some of the synchronicities with 1929.
Here’s another:
Let’s assume that September 26th was the SPX high for the move.
That indicates the Gann Panic Window opens on November 5th, the election, and extends to November 15th.
That’s interesting because the interim low after the 1929 big crash days was November 13th.
As well, November 5th is 90 days/degrees from August 5th…a Flash Crash low.
Got synchronicity.