“Patterns of price movement are not random.” Jim Simons
“The fluctuation of share prices is roughly proportional to the square root of the price.” Sir John Templeton
“Try to hard to stand alone
Struggle to see past my nose
Always had more dogs than bones.” Square One, Tom Petty and the Heartbreakers
The new posterchild for FOMO in the market has been IPO CRWV.
Interestingly CRWV didn’t start out as a hot IPO.
Most likely because it came public in the middle of the tariff panic.
It actually had to reduce its IPO price and then went underwater before fueling up for its
Recent rocket ride from 34 to 116 in 23 trading days.
It left the stratosphere just a week ago: from a low of 61.33 on May 15th it rallied nearly 100% in just 5 trading days.
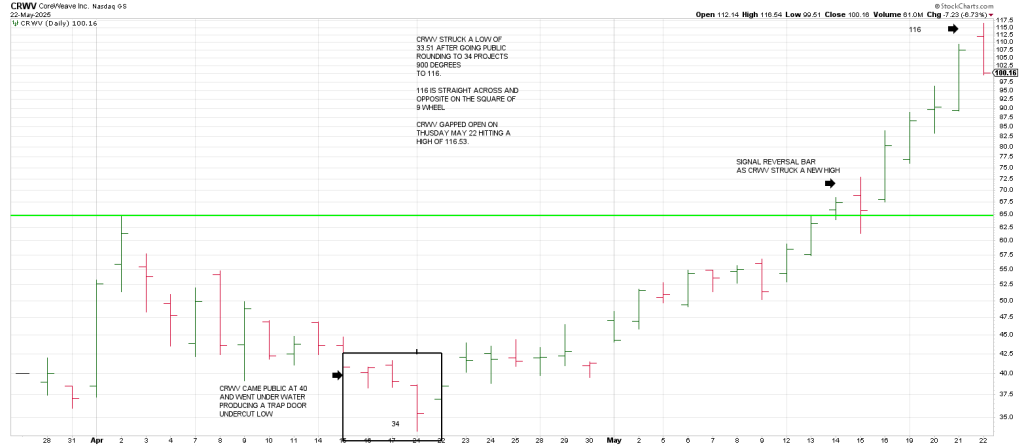
Notice the signal bar reversal day on May 15 when CRWV pierced the initial IPO peak.
When CRWV reversed above that reversal day the explosion began.
The rocket ignited with a Reversal of a Reversal or what I call a Keyser Soze (from the movie The Usual Suspects).
Fast moves come from false moves. CRWV went into overdrive when it cleared the May 15th “reversal”.
The rip was in the math.
Allow me to explain.
From the 34 low on April 21st we see that 116 is straight across and opposition 34.
This satisfied a 900 degree move.
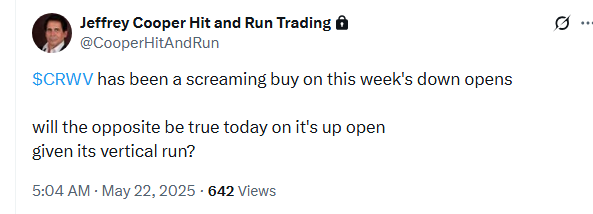
Thursday morning before the open we alerted on the Hit and Run Private Twitter Feed
That a gap open on CRWV should not be chased.
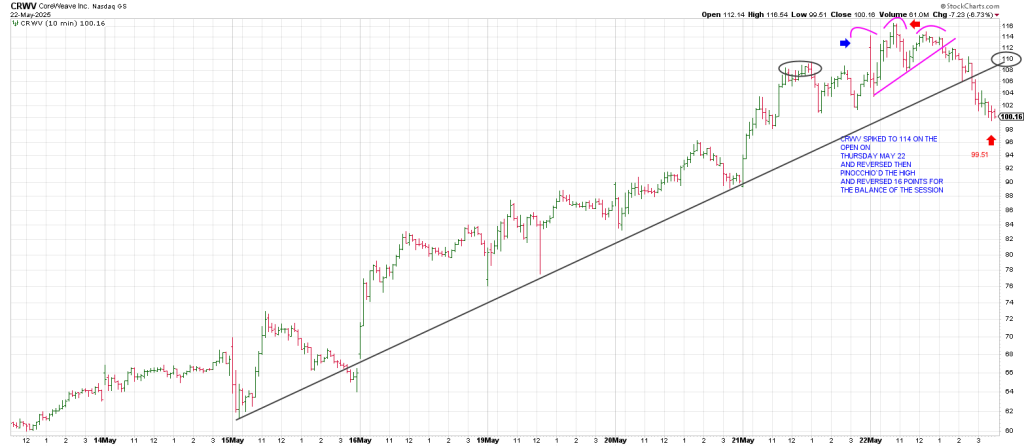
CRWV carved out a Spike and Reversal on Thursday’s open.
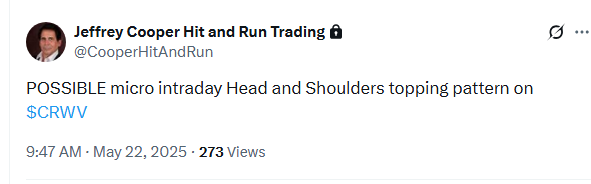
Then it tested the morning high tracing out a Trap Door, a Bull Trap confirmed by breakage below an intraday Head and Shoulders top pattern.
Thursday morning we projected a drop to 100.
Indeed the market is not as random as you have been led to believe.
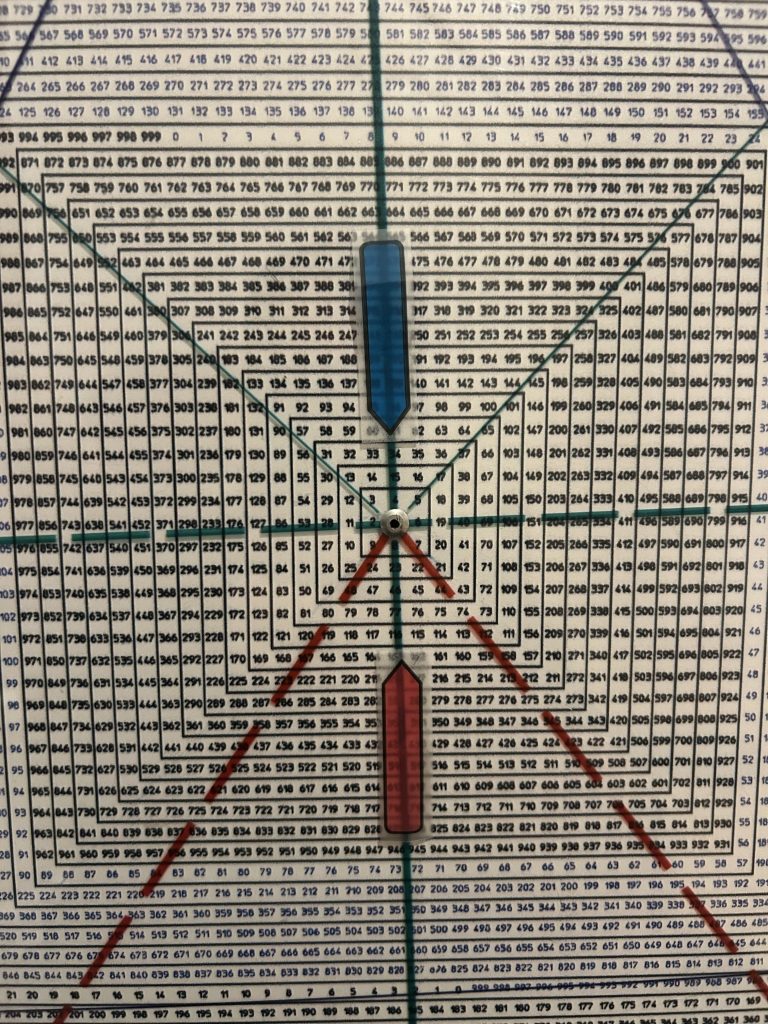
The Square of 9 Wheel pictured below is a Time and Price calculator.
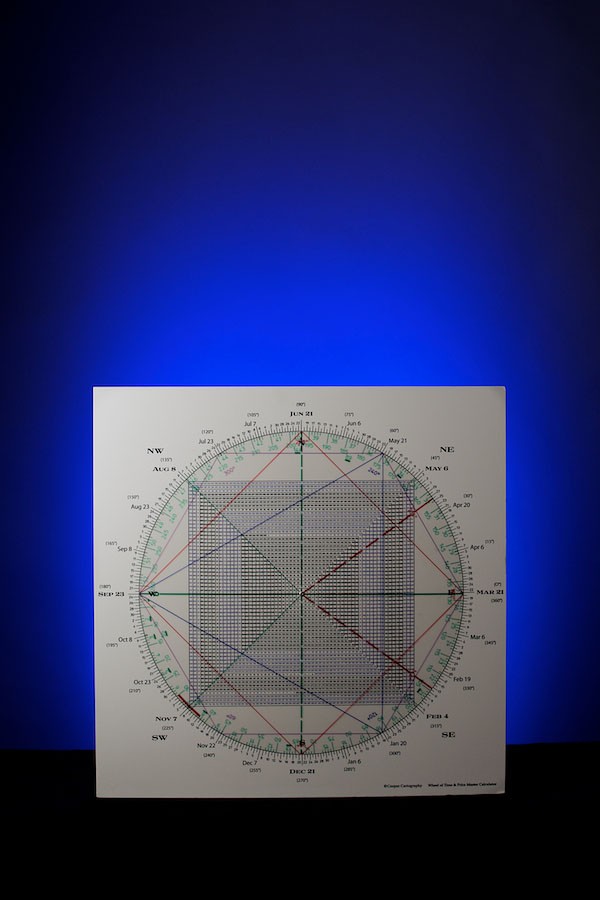

Square of 9 Wheel
Purchase your own Square of 9 Wheel. Shipping to US only. Contact Jeff for shipping outside the US.
As the market seer, W.D. Gann stated, “When time and price square-out, expect a change in trend.”
The Square of 9 Wheel integrates Time and Price revealing when then ‘balance out’ or square-out.
It isn’t voodoo. It’s geometry.
W.D. Gann, the seer stated: “If we wish to avert failure in speculation we must deal with causes. Everything in existence is based on exact proportion and perfect relationship. There is no chance in nature, because mathematical principles of the highest order lie at the foundation of all things. Faraday said: ‘There is nothing in the Universe but mathematical points of force.’”
Gann called it the Law of Vibration.
Every morning we produce a ‘Roadmap’ for the day that keys off this Law of Vibration along with other factors and fractals.
The Roadmap for Thursday stated:
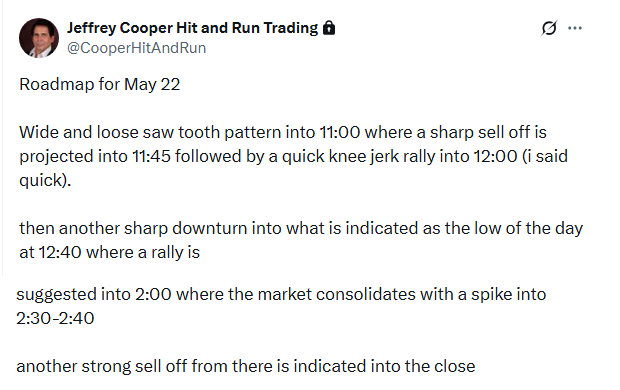
Let’s take a look at the blow by blow for Thursday in the SPX.
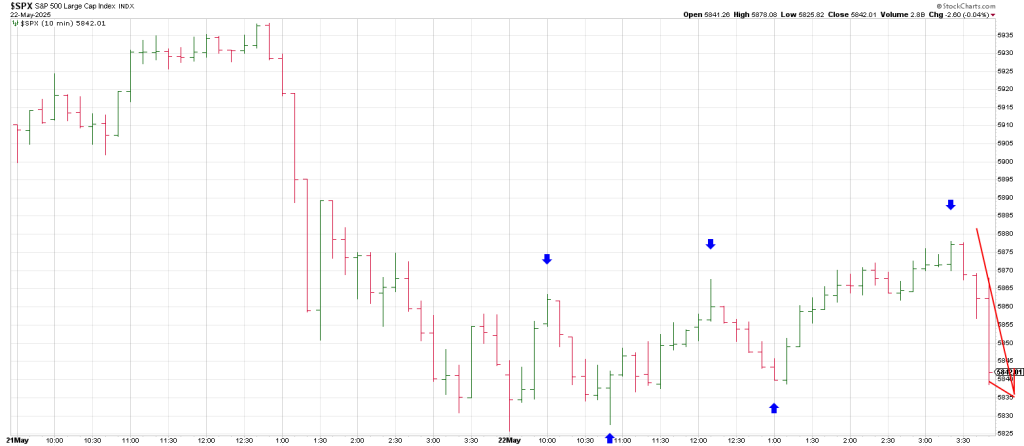
A rally played out into 10L00 an hour earlier than the projected morning high followed by a quick sharp selloff 45 minutes later.
A quick knee jerk rally followed into 12:10 followed by another sharp downturn at 1:00 just after the forecasted 12:40 turning point.
From there a rally ensued into 2:00 where the market consolidated prior to a spike higher into 3:20 —40 minutes after the forecasted spike high.
However, the rally was not to be trusted based on the Roadmap which called for a “strong sell off into the close”.
The sharpest move of the day was the drop from the high of the day into the close.
Amazing.
Tuesday’s report will take a deep dive into W.D. Gann’s interview by Richard Wyckoff in 1909 in which he discussed principles of natural law governing market movement and revealed he discovered what he called a Master Time Factor in 1908.
This is very timely as Gann’s Master Time Factor is due to exert its influence over the next few years starting this week.
Thursday’s late sell-off suggests it was a “Paws Day”, a pause in a continued correction to at least the open gap from May 12th.
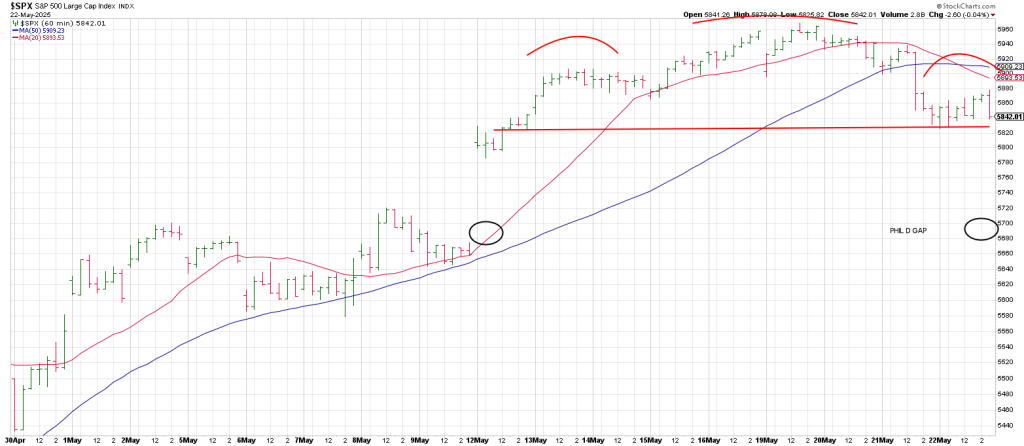
That’s the bull case.
The bear case is that a powerful Wave 3 decline has started following the Wave 2 countertrend rally off the April 7th low.