“While horsemen ride across the green
And Snow White still remains unseen,
Pegasus, the winged horse,
Relays his messages by Morse.” Pandora’s Box, Procol Harum
On Wednesday the NAZ closed down more than -2 % on a day the DJIA jumped to a new high.
Since the NAZ inception in 1971, this has occurred only twice before:
April 14, 1999
July 20, 2023
In both instances the NAZ fell more than -5 %T within the next month.
However, there are lies, damned lies and there are statistics.
While the above stats are true enough, following the drop into late May 1999, the NAZ melted up starting on the week of October 18th.
There we go again with those anniversary dates that W.D. Gann thought were so important.
Of course late October were the infamous crashes in 1929 and 1987.
From October 1929 to October 1999 is 60 years. Gann’s 60 Year Master Cycle saw the cycle invert in 1999. Amazing.
From 1987 to 1999 is 12 years or a Fibonacci 144 months.
These two important cycles produced a melt-up that would produce a 2 year crash as horrific as the melt-down from 192o9 to 1932.
In late October 1999 the NAZ crashed UP topping on the week of March 6, 2000…a 100% run in just over 4 months.
There’s another anniversary date…March 6th which became a major bear market low in 2009.
What about July 20th, 2023. That setup produced a well-defined decline immediately from NAZ 14, 446 to 13,170 three months later.
But again the damned statistic was followed by another melt-up.
My point is after we get the presumed “drop” I’ve been looking for to start from a mid-July peak,
Will we get another melt-up?
I think that depends on the kind of washout we get and how long it takes.
But it is worth remembering that we are synchronous with a cycle from 1929 and after the 1932, the DJIA went up five-fold in 5 years.
Never say never to Mr. Market.
As well, over the past week, there have been an average of 3 calls traded for every put in the Russell 2000 stocks.
That’s the most in at least 11 years, exceeding the prior high from September 2021.
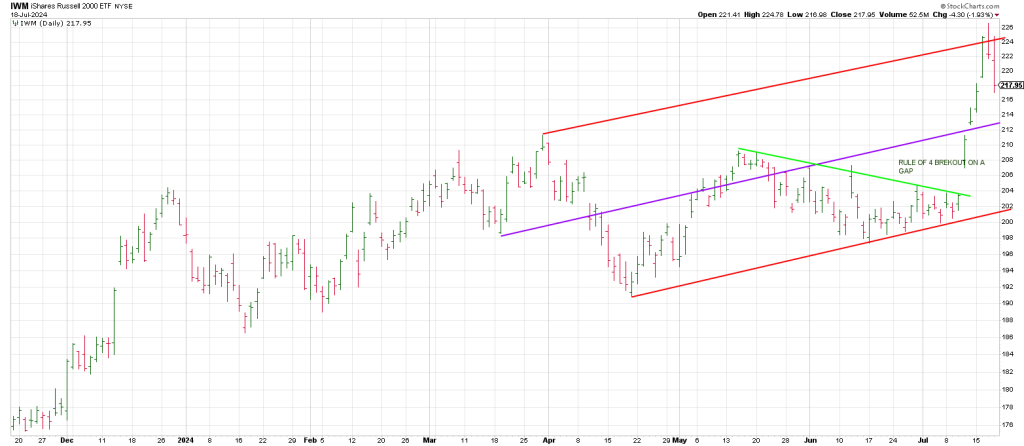
IWM left a Lizard sell signal (a new 10 day high Topping Tail) on Wednesday from a Pinocchio of a trend channel (red). It followed thru on Thursday. Dropping thru an open gap on Tuesday opens the door to the potential to 213 which is 90 degrees down from Wednesday’s 226.70 peak.
Notice that 213 ties to a mid-channel line and an open gap as well.
The message of the IWM chart was a rocket was coming off the launching pad when a Rule of 4 Breakout was triggered on a massive gap on July 11.
The move is consistent with a 3rd Wave suggesting when the current pullback ends another rally could play out with a somewhat higher high.
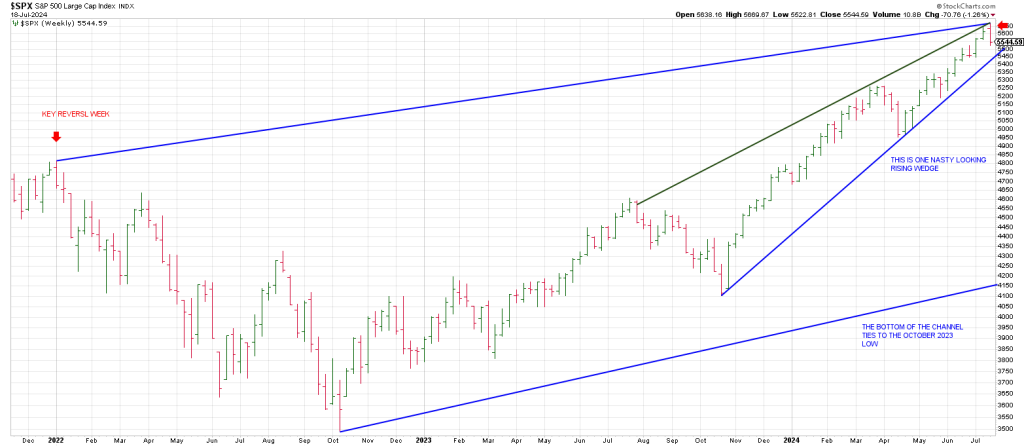
The SPX is threatening a Key Reversal Week. This is a week that scores a new 52 week high but drops to close below the prior week’s low. In this case it is all the more dramatic potentially because it comes from an all-time high.
Voodoo technicasl?
The last time the SPX left a key Reversal Week was the first week of January 2022. That was also a record high from which the index dropped from 4818 to 3491 in October, almost 28%.
For its part the DJIA left a large range Key Reversal Day on Thursday suggesting a pullback to the prior June highs. That’s a 600 point decline from here.
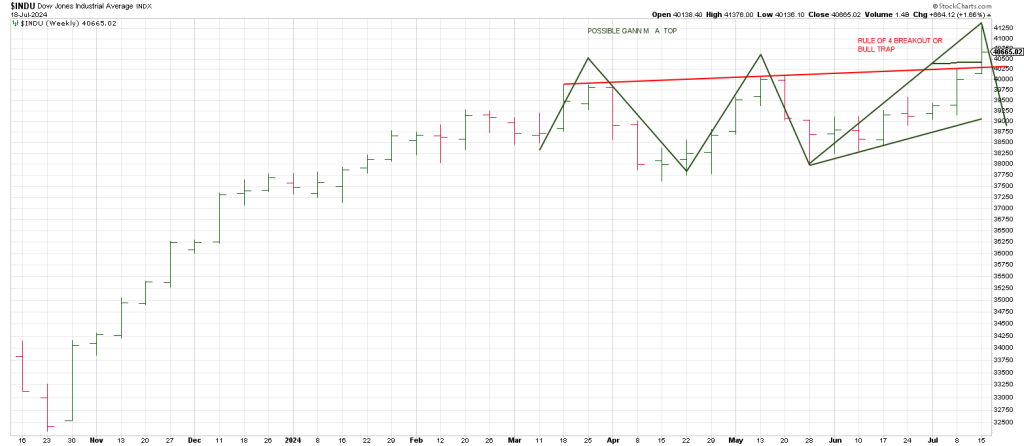
More importantly the DJIA is working on a Gann M A Top on the weeklies.
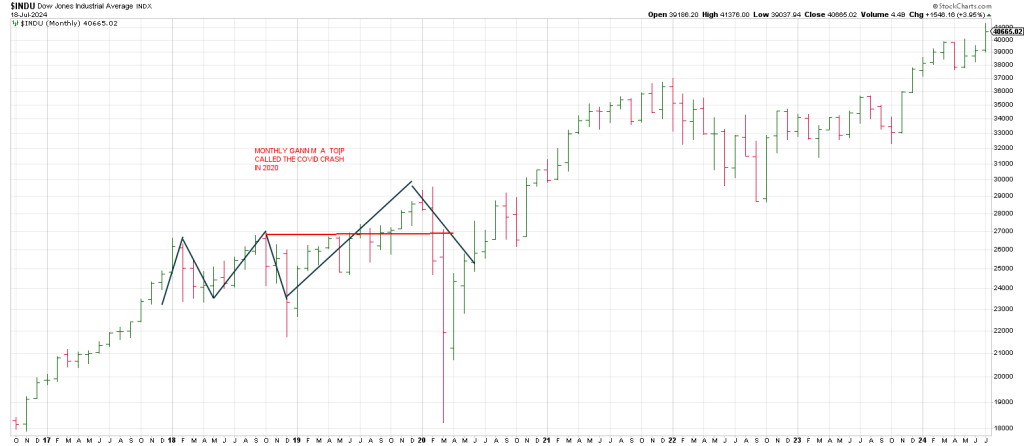
To put that in perspective the Covid Crash followed a MONTHLY Gann M A Top.
When price reverses through the peaks of the M it is a warning sing.
A decline below the feet of the M is a blaring sell signal.
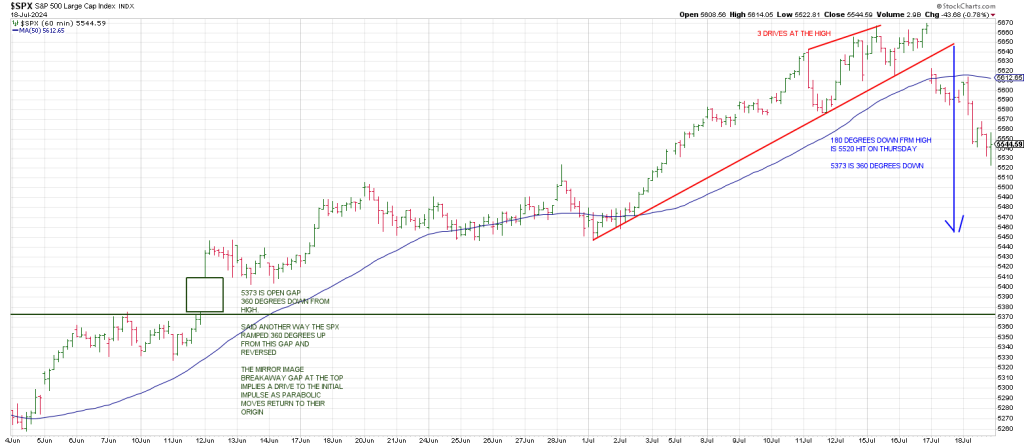
In sum, the SPX satisfied our initial downside target of 5520 on Thursday.
This is 180 degrees down from the all-time high of 5669 recorded just 3 days ago.
The SPX respected 5520 the first time down rebounding to recapture its 20 day moving average residing at 5545.
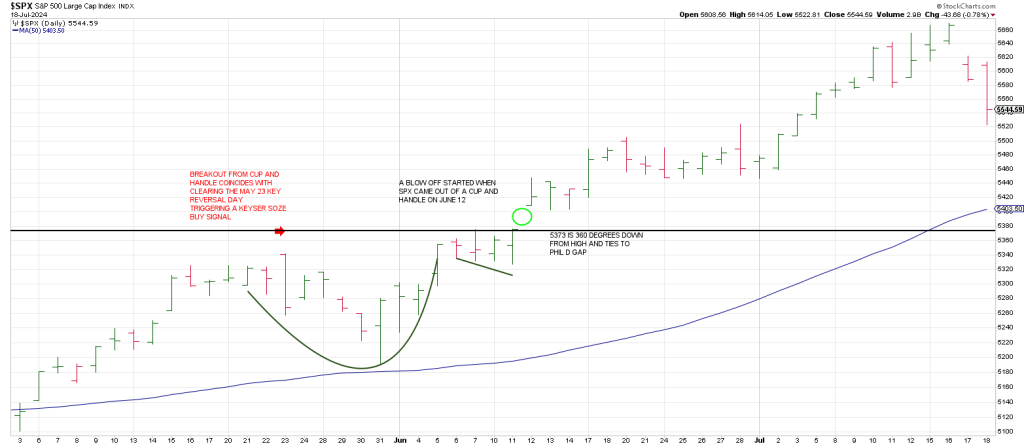
The above daily SPX shows a blow-off commenced on June 12th when the index gaped up out of a Cup and Handle.
Interestingly that open gap is at 5373 which is precisely 360 degrees down from the all time high.
In short, the SPX may have reached a mid-point in a leg down.
Breakage below the 5520 region with follow thru targets Phil D Gap…and the 50 day line.
Caution is warranted: when parabolic moves end they often return to where they started…in this case 5373.
That said the bulls would like to avert a Pandora’s Box and a Key Reversal Week which would be registered with a close below last week’s 5562.51 low.
It looks like they already started to pull the stops out and save the baby by bidding up NVDA and AVGO late Thursday. ARM is up sharply pre-market as I write 3 hours before the open.
Above we noted that a blow-off phase started on June 12th.
7 weeks from a melt-up peak ties to W. D. Gann’s Panic Window…if a panic is going to play out.
This 49-56 calendar day window could mark a high if the market regains momentum and rallies into that time frame.
Alternatively downside momentum could see a selling panic starting in this time frame and continuing into early August.
The 42nd anniversary of the 1982 low.
As shown in yesterday’s report 42 is 180 degrees straight across and opposite August 8th.
So there is some good synchronicity on the table for a major move.
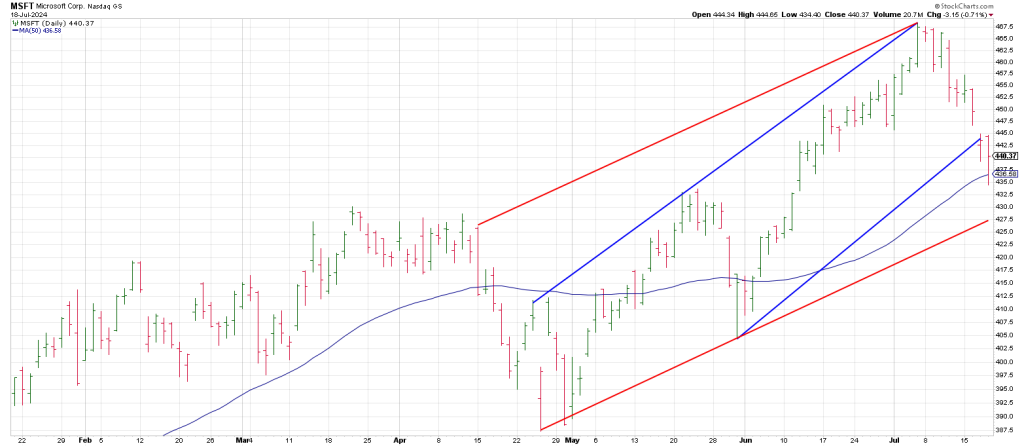
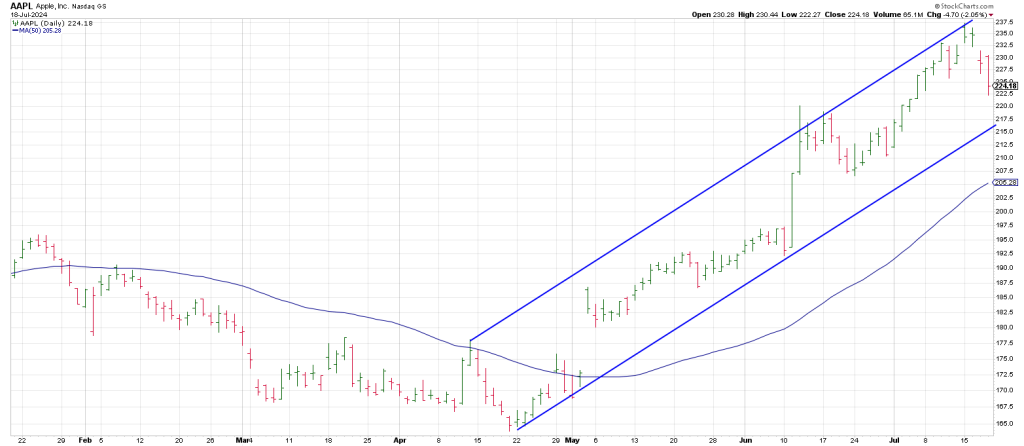
Checking the Mag 7, their position doesn’t argue for a resumption of the runaway move in the SPX.
The message of the market argues for caution as cycles converge this July…
17 years from the July high the last primary bull market top.
17 years before that was July 1990 and a panic into October.
17 years before that was 1973.
The DJIA staged a false breakout in January 1973 leaving a Signal Bar Reversal week.
It plunged into June where it rallied sharply for 3 weeks into the week of July 23rd to 944.
It fell out of bed over the next month to 845, an 11% decline.
Last summer the SPX declined precisely 11% from a July peak.
Is another 11% drop on the table?
An 11% decline from this weeks high is 5046.
11% is hardly a panic, but it will feel like one because it will virtually wipe out the last advance from The April low.
5046 is Phil D Gap where the vertical run started.
Given that the SPX has not tested its 200 day moving average since last October’s low, it would not be surprising to see a greater than 11% decline that tests the 200 DMA currently residing at 4945.
That represents an undercut of the April low.
In short the Pandora’s Box is the open gap at 360 degrees down at the 5373 region which ties to the 50 dma. Breakage below opens the door to the 200 dma at 4945.
It may be a waterfall decline given the indiscriminant selling in tech of late.
Interestingly on the Square of 9 Wheel 494/495 ties to early October, an important anniversary pivot in market history from 1929, 1987, 1990 and 2002 to mention a few.
Today is a huge day. 2.7 trillion in notional options will expire today.
The largest every July OpEx in history.
The tail could wag the dog which everway the Algomatics want.
A Snapback to 90 degrees down from high to 5585 and the 56o SPY strike could play out.
But breakage below 5520 opens the downtown door.

Square of 9 Wheel
Purchase your own Square of 9 Wheel. Shipping to US only. Contact Jeff for shipping outside the US.