Yesterday we mentioned the Momentum Peak prior to the February top ended on December 16, 2024 with 90 days/degrees square that time frame tying to the March 16 low of the first leg down.
180 degrees from the Momentum Peak and 90 degrees from the March 13 pivot is June 13 to 16.
It was brought to my attention that June 15 is a Jupiter/Saturn square.
This is the third in a series.
The first was on August 19th 2024. This ties to the Flash Crash into August 5, 2024.
The second was December 24th, 2024. This ties to the aforesaid Momentum Peak
The SPX price at that December Momentum Peak was 6085.
You see the significance. The SPX has been below the December Momentum Peak for 6 months.
The August 2024 Flash Crash low was 5119.
While the plunge into April 2025 undercut the August 2024 Jupiter/Saturn low, the weekly closing low in April was 5074. This is basically a perfect test/double bottom with the 5119 August 5 2024 low.
In fact the weekly closing low in early August 2024 was 5344.
I bring this up because as touched on in my recent article Gann’s Master Time Factor, I note that Jupiter and Saturn were Gann’s Chronocators or Time Keepers.
There is a strong likelihood that this mid-June period is going to be a significant turning point.
Since the first Jup/Sat square marked a mini-crash and the second a momentous peak, June should be an important turn.
The Principle of Alternation suggests it will be another waterfall event, but it could be both—a Spike and Reversal, a high followed by a plunge.
Since many individual stocks are surging even though the SPX is not in new high territory, we need to be alert for a high.
As well complacency is thick. This weeks doubling by Trump of tariffs on EU steel and his threat to make a deal by this week has been shrugged off by the stock market.
Not so much the precious metals.
As well, the SPX has shrugged off two early sharp sell-offs on Monday and Tuesday…coming out of what looks like a mini continuation inverse Head and Shoulders yesterday.
In sum the SPX tested a 20/200 day Moving Average Bowtie on May 23rd and pushed higher.
Breakage below the 200 day moving average in June will underpin that the Jupiter/Saturn square is exerting its influence to the downside.
However, prior to that the door is potentially open to a push to a nominal new high.
Think October 2007. The SPX struck a Primary High in mid-July.
Three months later a nominal new high, a Secondary high was struck in mid-October.
A Secondary High can be 3 to 5 months following the Primary High (same with bottoms).
In 2000 the Secondary High was in August, 5 months after the March Primary high that year.
This June will be 4 months from the mid-Feb Primary high.
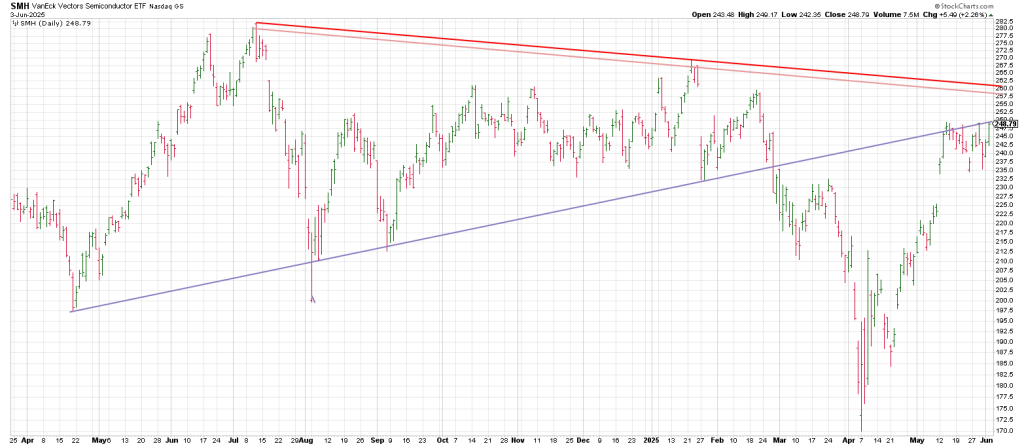
The semiconductors will be a good tell. They are at an inflection point.
CRWV is the posterchild for the market ramp since the April low.
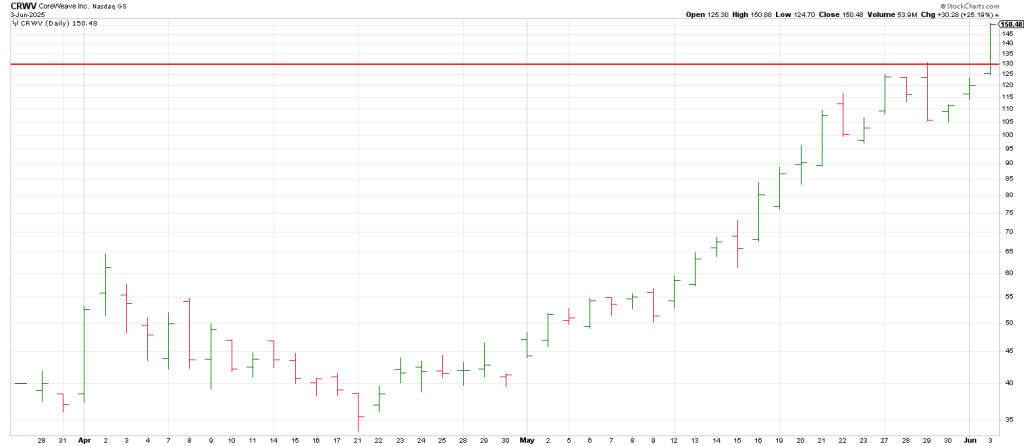
CRWV carved out a large range Key Reversal Day on May 29.
The next session it traced out a second lower low satisfying a daily Plus One/Minus Two buy setup.
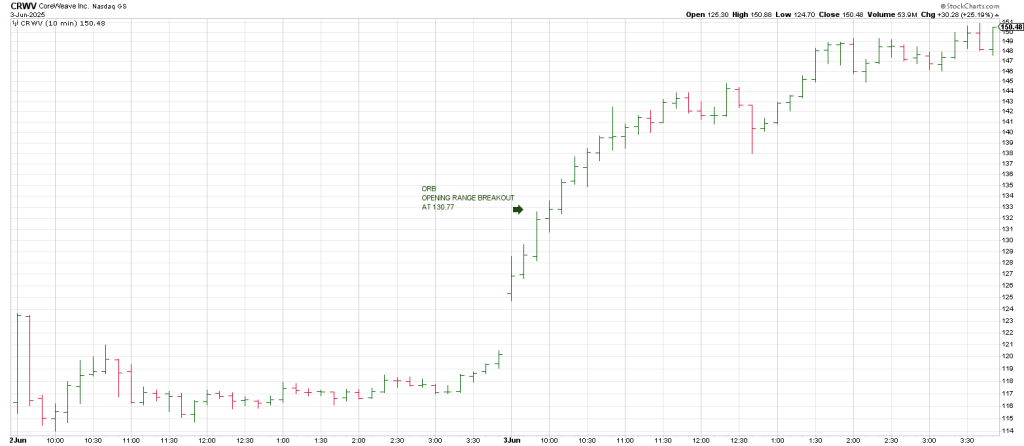
Yesterday when CRWV cleared the high of the Key Reversal Day it triggered a Reversal of a Reversal or what I call a Keyser Soze.
The Keyser was triggered long at 130.77. CRWV exploded to close at 150.88 and tacked on another 5 points after hours for good measure.
Why the Jailbreak Rally?
CRWV was a glamor IPO that came public in April in the middle of the Tariff Panic.
That dampened its initial prospects.
Yet there was a lot of smart money that was in on the private placement that had “lock up shares”.
Those shares don’t ‘unlock’ until September 24th.
My take is this smart money orchestrated CRWV higher so that when the lock up was off the ‘selling pressure’
Would have a ‘cushion’.
The momentum got out of hand as these things often do.
It’s a matter of positioning and psychology squared.
I know of one insider who has lock up shares who started shorting last week to hedge his locked up shares.
In other words they thought CRWV was overdone and wanted to try to capture these stratospheric prices.
As it turns out these strategic shorts are in turn getting squeezed…they can’t deliver shares that are not available until September.
When shares get called away from them, the frenzy to cover mixed with momentum buyers and those who think that CRWV is the new NVDA become a potent bullish cocktail.
CRWV has cut through all potential square-outs like the proverbial knife thru butter.
When you see this playing out you know that something different is going on.
There is a message in square-outs being eclipsed.
That said from the 34 low on April 21st.3 full revs of 360 degrees up is 139.
When CRWV exploded over 130 it opened the door to the next 90 degree decrement higher which is 151.
151 also aligns with March 28, the day CRWV IPO’d.
Above this 150-151 region, it’s pure octane.
Speaking of octane. Today all eyes will be on the precious metals which look like they traced out a Pause Day following Monday’s surge.
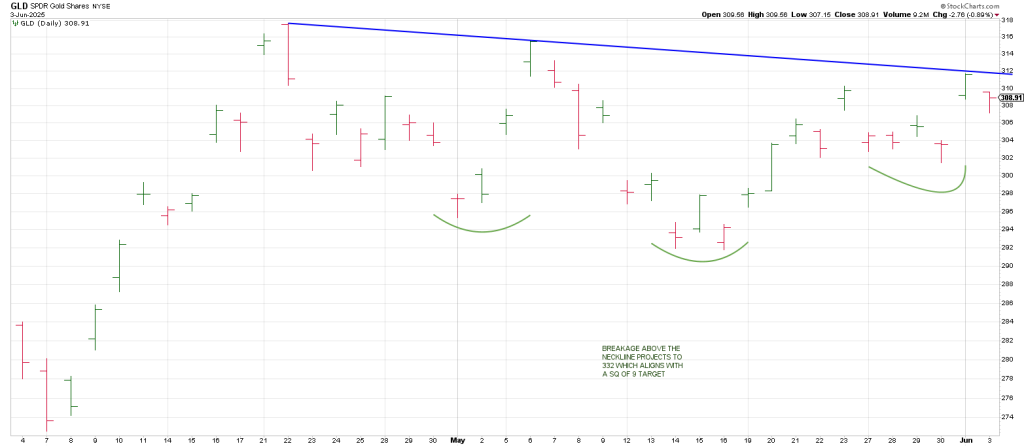
An inverse H&S on GLD projects to 332 in league with our Square of 9 target.