The week of September 16 kicked off with the Fed’s 50 basis point rate cut on Wednesday Sept 18—the same day the Fed made an 50 basis point rate cut in 2007, with the market near all-time highs.
We all know what followed.
Is it ‘different this time’?
We wrote up the Fall Equinox and what is called Gann Day as it is the day that has marked major turning points more than any other in history (+ or -).
The SPX initially surged to an all-time high of 5688 after the Fed ‘news’ but reversed course the same day posting a bearish Key Reversal Day. Notably the index closed at its low on September 18th.
However, the next day however produced another record high for the SPX, with a massive up-gap.
The next week, the week of Sept 23rd, started with the market action marking the narrowest trading range since the July peak…setting the stage for what followed.
The market action on Sept 25 stands out as the most pivotal yet.
While the day ended with mixed results—DJIA dropped 293 points, SPX fell by 10, and NAZ rose by 7. The small caps (IWM) registered a decline equivalent to a 600 point drop in the DJIA.
Yet the real story lies beneath the surface.
New advances were weak with a decline of -1,125 on the NYSE and -1552 on the NAZ..
Since then the market and momentum have continued to weaken.
Although the SPX has declined by 12 points over the past week, the McClellan Oscillators and the Summation Index Indicators for the NYSE and the NAZ have hit new lows signaling a more profound underlying weakness.
Let’s look at what has played out since Fed Day.
Following the dual narrow range days of 9/23 and 9/25 the SPX popped up to a record high on September 26th cut could not build on the momentum…closing well below session highs.
Since that record high the SPX has gone on to immediately turn down its 3 Day Chart.
This is directly following an all-time high and the Fed ‘celebration’
Often times turn downs of the 3 Day Chart right off a record high have marked important highs.—
If validated by further downside follow thru. Often this meant a knee-jerk rally that saw 2 consecutive daily higher highs which put the market in the Minus One (3 Day Chart pointing down)/
Plus Two Sell position.
Despite yesterday’s turndown of the SPX 3 Day Chart, the index rebounded off session lows to close near session highs although only to the flat-line.
The roadmap that called for the SPX to find a high mid-day played out but the subsequent decline was not a cliff dive as the math indicated.
Be that as it may, breakage today below yesterday’s low and the 3 Day Chart low is a conspicuous change in character—especially if it produces downside follow through.
Why? A turndown of the 3 Day Chart accompanied by downside follow thru is not the stuff of a runaway move and a new leg up.
That new leg up would project to 5860 square-out around the Oct 11 key anniversary period.
As well clearing 5860 potentially opens the door to 6000-6100.
We also know that October 4th was the final rally pivot high (lower high) prior to the crash in 1987 and that October 11 was the final rally pivot high (lower high) prior to the crash in 1929.
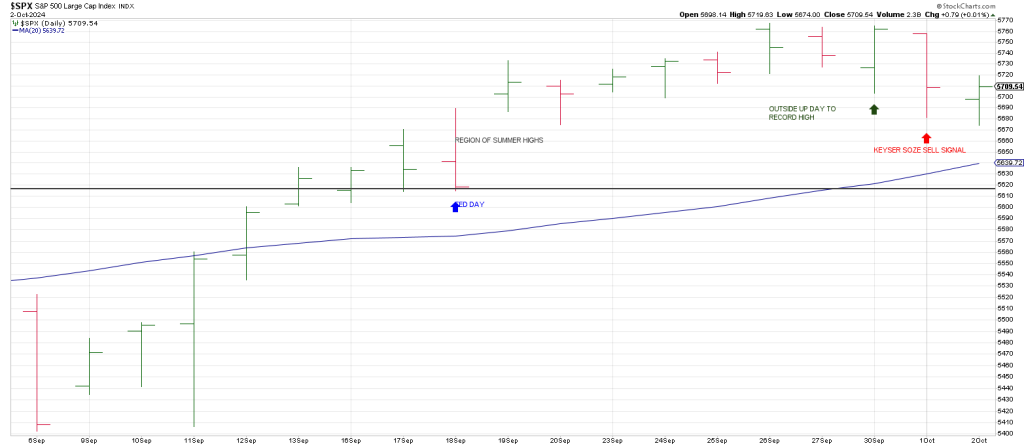
It’s a technical tug of war. The SPX is still holding above the summer highs—5650-60—but it looks like it’s got a date with its 20 day moving average at 5640 which ties to the summer highs.
In sum, breakage of the 20 day ma in tandem with a failure below the summer highs leaves the idea of a Buying Climax run in jeopardy.
The real story is the record closing high on quarter end, September 30th.
The SPX opened down but saw a last hour orchestrated rip.
It produced an outside up reversal day at a record high.
Where’s the beef? There was no follow thru.
Instead, the session saw the SPX print below September 30th’s upside reversal day. October 1st saw a Reversal of a Reversal.
So the first day of October saw Keyser Soze show up. It’s his favorite month.
Just below the 20 dma is the Fed Day low of 5615.
Below that and something is rotten in Denmark.