“These things have always been the same.” Why Worry, Emmylou Harris, Mark Knopfler
“There is nothing new in Wall Street” Jesse Livermore
“What has been is what will be, and what has been done is what will be done, and there is nothing new under the sun.” King Solomon
A picture is worth a thousand words.
Today we have a couple of pictures for you.
Below is a daily SPX from the July peak with the NY McClellan Oscillator below.
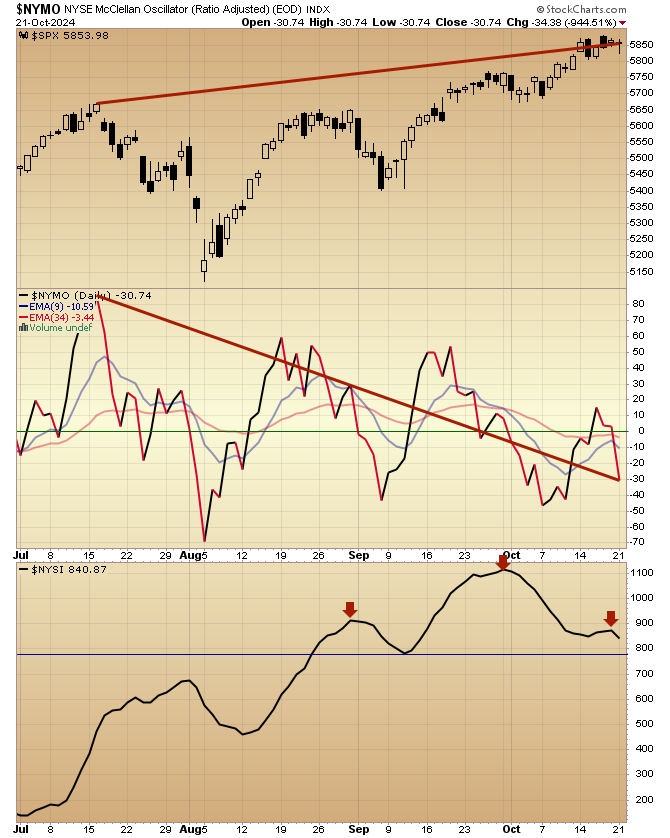
Since mid-July the SPX has advanced 200 points, while the McClellan Oscillator has declined by 113 points to -30.74.
Momentum isn’t just spent. It’s turned negative.
Notice in the chart above the McClellan Oscillator peaked in July and has traced out three lower highs
W.D. Gann wrote that fast moves come from third lower highs.
This massive three month divergence has produced what I call the Jaws of Death…
Because they snap all of a sudden and take traders limbs without much warning—
Unless you heed the warning signs right in front of your eyes right here, right now.
The third panel is the N Y Summation Index.
Notice how it appears to have formed a Head and Shoulders top.
The Neck Line is just below current levels.
Breakage below the Neckline…in keeping with the 3rd lower high on the McClellan suggests that July was a Primary High and the market is forming a Secondary High currently.
Secondary Highs can be lower highs (than the initial high) or double tops or higher highs.
The October 2007 high was a slightly higher high than the July Primary High that year.
Before the Covid Crash in 2020 the SPX struck a Primary High on January 22 and a HIGHER Secondary High a month later on February 19th.
If indeed 584 represents a Secondary High, it follows that the ensuing decline may echo the drop from the July high…but STICK.
Theoretically the ‘echo’ could be more extreme.
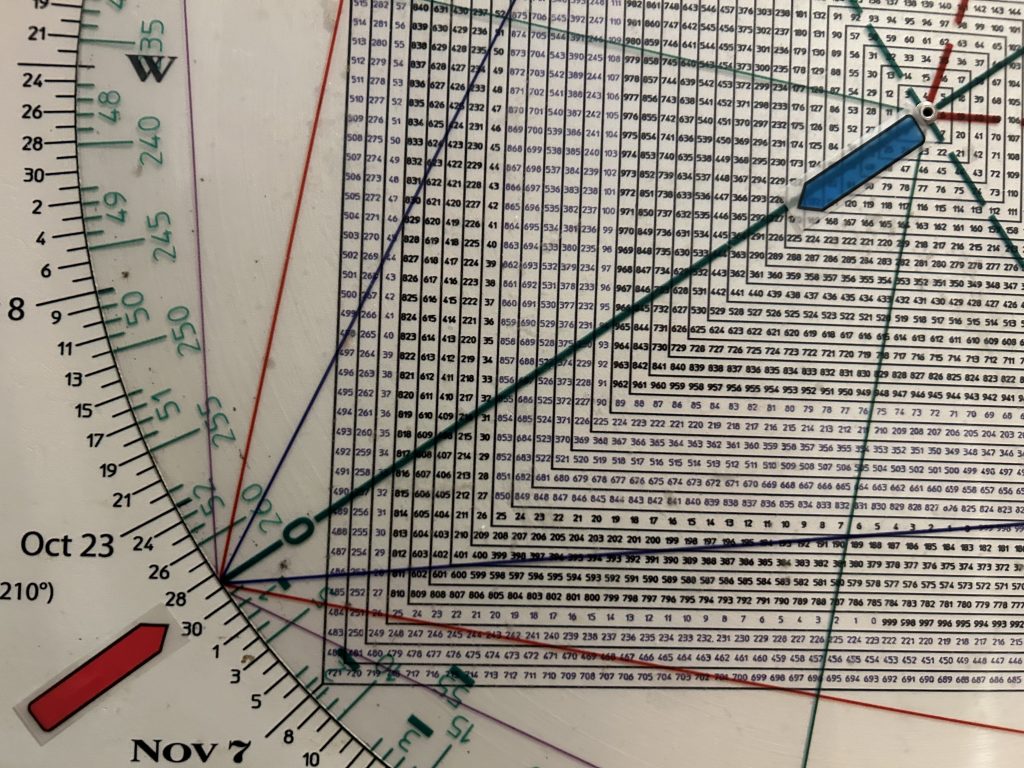
W.D. Gann believed that because of ‘Solar Returns’, anniversary dates exert a profound influence on market trends.
We are in the window of the anniversary of the 1929-1932 Cycle.
Why? 1929 was 95 years ago. On the Square of 9 Wheel, 95 squares out with early October, the final pivot high in 1929 and conjuncts July.
1932 is 92 years ago. On the Square of 9 Wheel, 92 conjuncts the Flash Crash start this July 31 and squares-out with OCTOBER 29, the Big Crash in 1929.
In sum, again on Monday, the SPY wrestled with 584. It dipped to 580.60 mid-day in keeping with ‘the roadmap’ then walked back home…to 584.
The SPY closed just shy of 584 at 583.63.
Let’s take a look at 5840 (584) through the lens of the SPX cash, versus the SPY.
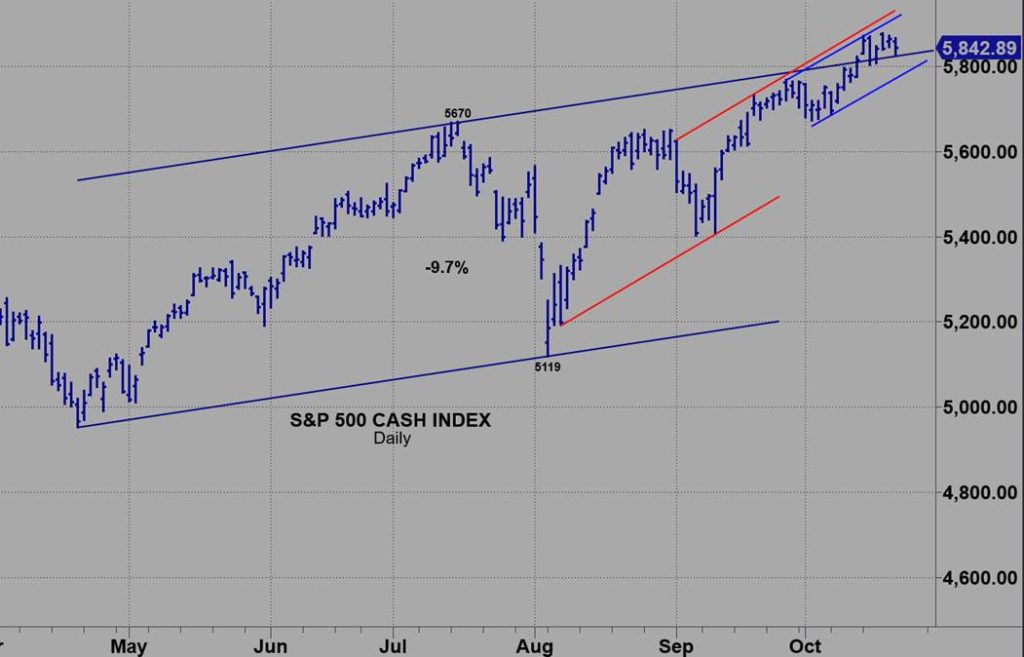
I connected the April and August low and then paralleled a like from the mid-July low.
What does it hit? You guessed it 5840 region.
As you can see the SPX broke out above this trendline but the breakout has not perpetuated an extension. The SPX has been flat-lining.
Monday it backtested “the line” for the second time.
The first was the day after the breakout.
In a strongly bullish tape, the first ‘check-back’ should have generated upside momentum.
It did not.
Tuesday is the second test of “the line.”
It’s World Series time. 3 strikes and you’re out.
Breakage below the Tops Line implies a false breakout at the key 5480 level.
I drew a small rising channel (blue) from the October low which comes in at 5800.
Downside follow thru below 5800 opens the door to the bottom of the red trend channel which ties to 5660. This ties to the JULY HIGH. It is where the 50 day moving average resides currently.
A failure below the Primary high should confirm a major high is in—especially following 3 Drives to a high from the August low.
The McClellan Osc and Summation are sending Waterfall Readings.
IWM, The Truth Teller shows a Waterfall Warning.
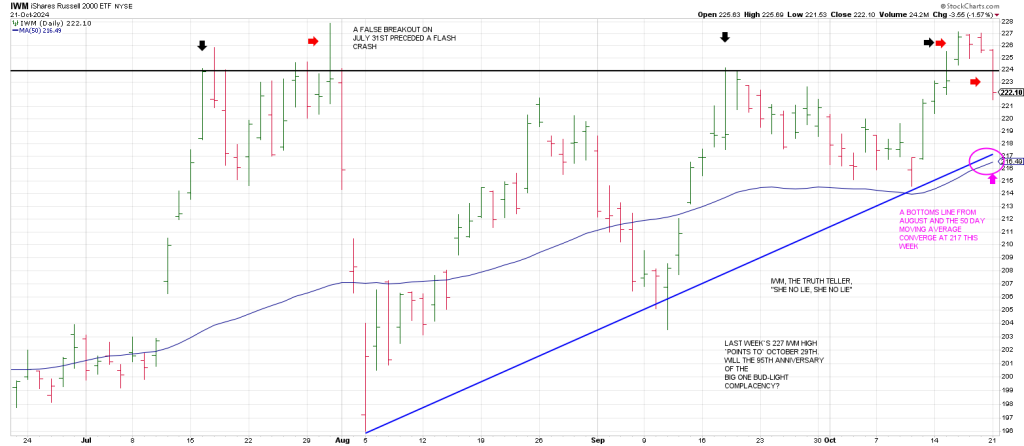
IWM struck a closing high on July 16th. It tried to breakout the next day and faltered.
Then it attempted to breakout on July 31st but left a signal bar reversal.
The next day started a Flash Crash.
The black horizontal line on the chart is the July closing high.
Notice how the black line rejected price on September 18th with another signal bar reversal.
Last week we got a close above the line, Wednesday, Thursday and Friday.
Monday IWM gaped down and close meaningfully below the line.
Flash Crash Part Deux?
Downside follow thru should see IWM magnetized to a Bottoms Line from the August low.
This ties to the 50 day moving average.
Breakage below the blue Bottoms Line triggers a Rule Of 4 Sell signal.
In sum the overall complexion looks like a Waterfall Pattern.
Isn’t it fascinating that 227, last weeks high, points to October 29th.
Will the 95th anniversary of The Big One budlight complacency?