If volatility precedes price, Thursday was the poster child for this maxim.
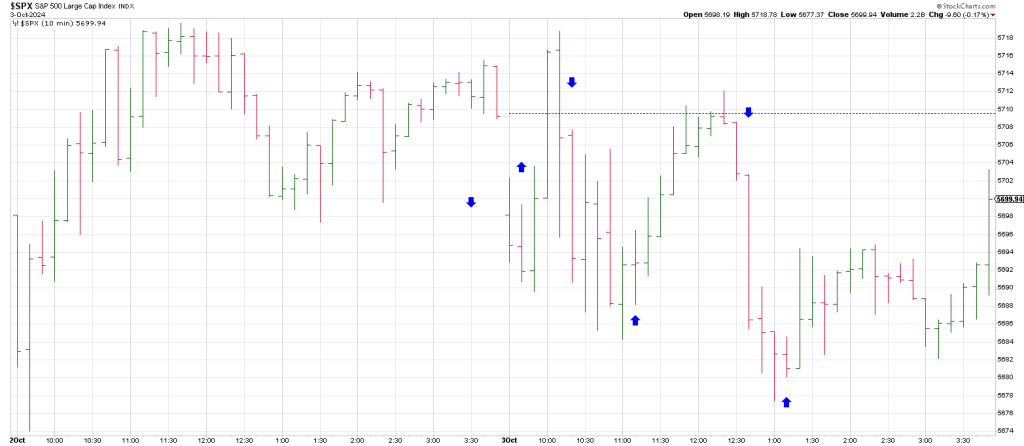
It was an FOMC Cha Cha Day with the Fed MIA.
For all the gyrations the SPX carved out an inside day.
The index turned the important 3 Day Chart down on Wednesday
If the agenda is higher, this first turn down in the 3 Day Chart off the high for the move should define a low which produces momentum to new highs.
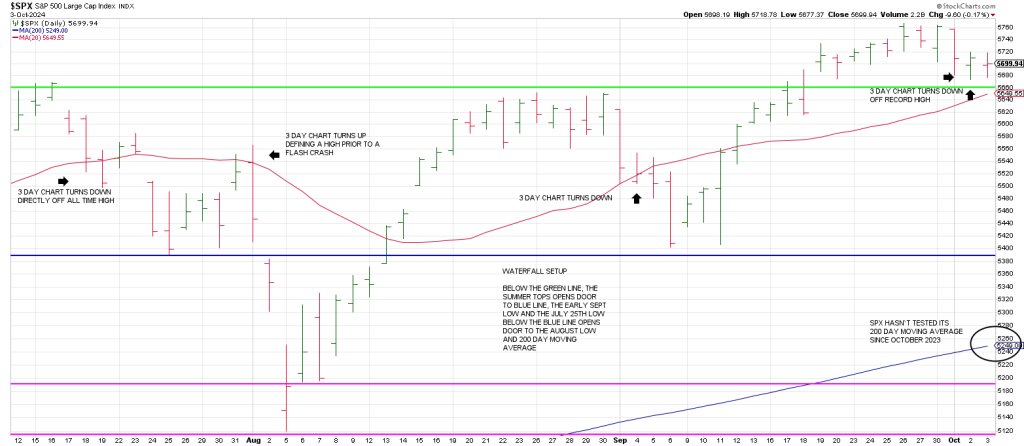
Alternatively, downside follow through after a turn down in the 3 Day Chart directly off a record high leaves the market suspect.
The SPX turned its 3 Day Chart down directly off the July peak and then proceeded to trace out 2 consecutive higher daily highs putting in the Minus One/Plus Two Sell position, a bearish setup that perpetuated the Flash Crash.
Will we get two consecutive higher highs from here setting up another waterfall that tests the August lows?
Interestingly, an hourly SPX shows that a snap back could install the right shoulder of an hourly Head & Shoulders coincident with a backtest of the 50 hour moving average
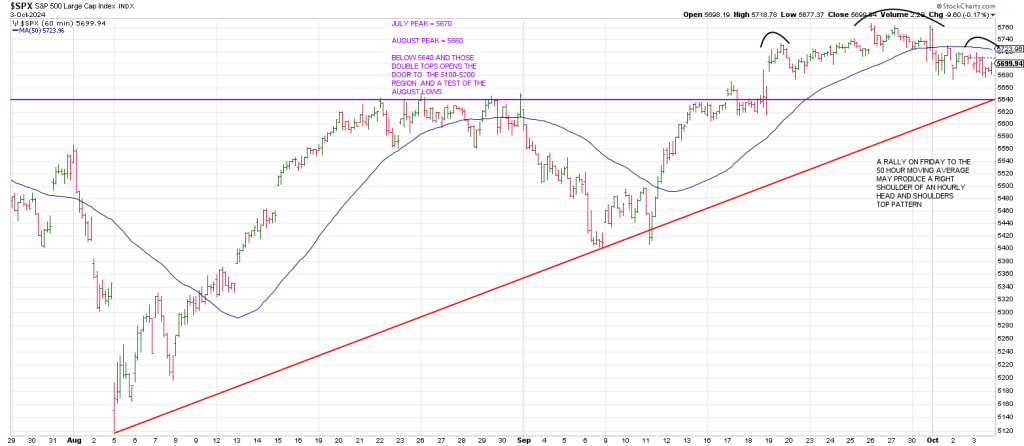
Be that as it may, breakage below Wednesday’s 5674 low targets the 20 day moving average (5650) which is just below the summer highs in July and August—essentially double tops at 5670 and 5650 respectively.
Notice the confluence between the September consolidation and a Bottoms Line (red) connecting the August 5th low and the early September lows.
The SPX broke out above summer “double top” the day after the Fed cut rates on September 18th, the same day they cut rates 50 basis points in 2007.
The market struck its bull market top a few weeks later in 2007 kicking off a brutal bear market.
The SPX dropped from 1576 to 666 on March 6, 2009.
Is this time different?
Notably 1576 squares out with October 7/8 which produced the Time/Price square-out at the Oct 2007 top.
Will that harmonic be felt this October? Perhaps, because the Primary High in 2007 coincides with the July peak this year.
The aforesaid summer double tops can be probed, but a conspicuous failure below 5670-5650 is a warning sign. The Sign of the Bear.
In sum, we have a Technical Trifecta on the table:
- The summer double tops
- The Bottoms Line from the August and September lows
- The 20 day moving average at 5650
How did the market get here?
Checking a monthly SPX shows a Cup and Handle with the turn down in the 3 Month Chart defining the Handle in October 2023.
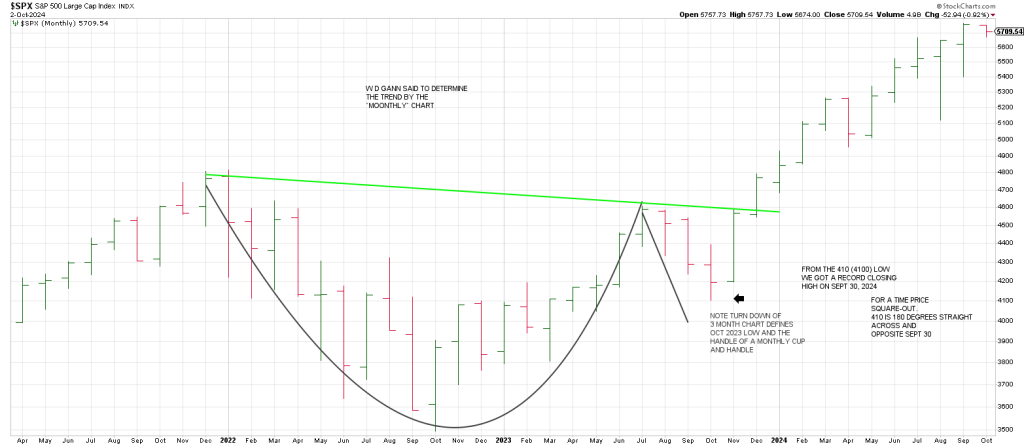
From the Oct 2023 low of 410 (4100), the SPX ran up to a record closing high on Sept 30th, 2024 perfecting a Time/Price square-out.
This is because 410 is 180 degrees straight across and opposite September 30th.
Seven weeks is WD Gann’s Panic Zone (up or down).
The SPX ran up 646 points in SEVEN weeks from the August 5th low— approximately 13 %.
That certainly qualifies as a Buying Panic.
As well August 5 squares out with 577. The all-time high was 5765, rounding is 577.
The longer we hold below the September 30th high, the stronger the likelihood that the square-out will exert its downside influence.
Throughout this year we’ve showcased several synchronicities between 1929 and 2024.
In particular, we are 95 years from 1929 and on the Square of 9 Wheel, 95 points to October 4th, today.
Today we get a potential catalyst with the jobs report.
Is it possible the SPX breaks through the summer double tops and the 20 day moving average today triggering the Sign of the Bear to go neon?
Wouldn’t it be typically perverse of Mr. Market to have already topped just when some of the smartest bulls and bears alike are doing a Cheech and Chong…looking for one more good high.

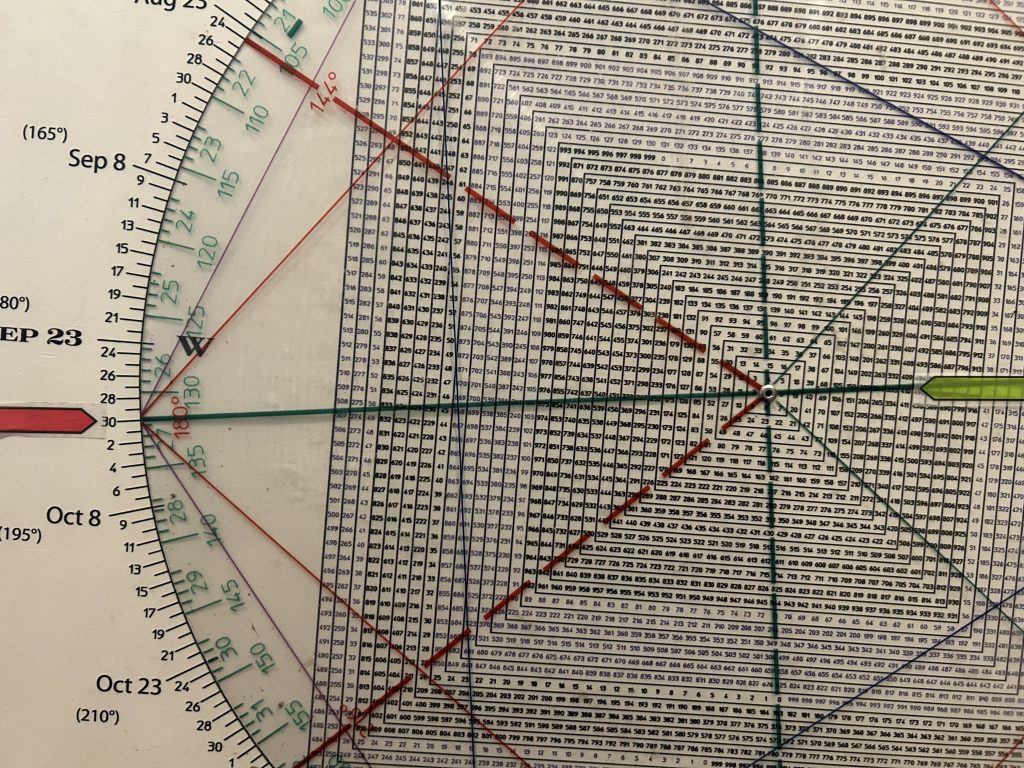
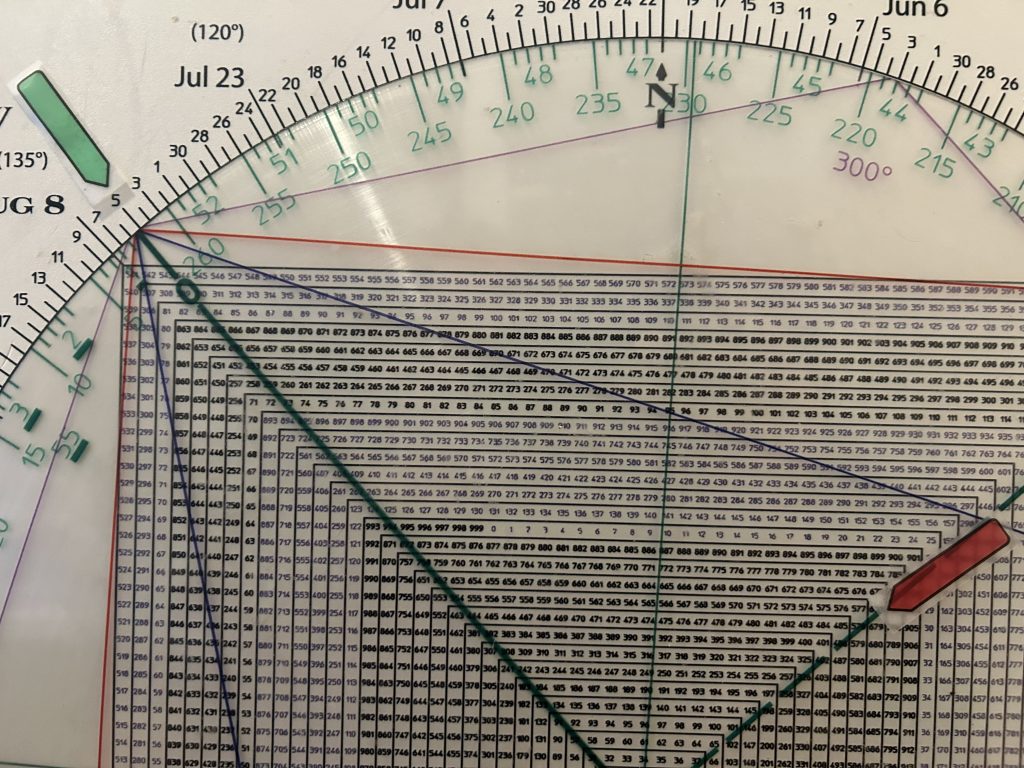
Square of 9 Wheel
Purchase your own Square of 9 Wheel. Shipping to US only. Contact Jeff for shipping outside the US.