Market crashes are rare birds.
It didn’t look like a crash was on the table as recently as February 19th when the SPX struck an all time high of 6147.
Yet my cycle work maintained that the market would crash from a high in January.
To be sure, the new high in February had me on my heels.
In addition to the cluster of astro cycles mentioned late last year that were due to exert their downside influence, this 610 (6100) is straight across and opposite July 8th.
July 8th was the Great Depression price low of the DJIA.
The presumption is this would be important given the trend line from the late 1920’s shown in this space. (I will look for that chart this weekend and post it here on Monday).
Going into January we noted that 2025 is 93 years from the 1932 low and 93 is straight across and opposite mid-January. Our orthodox high was scored on January 23/24.
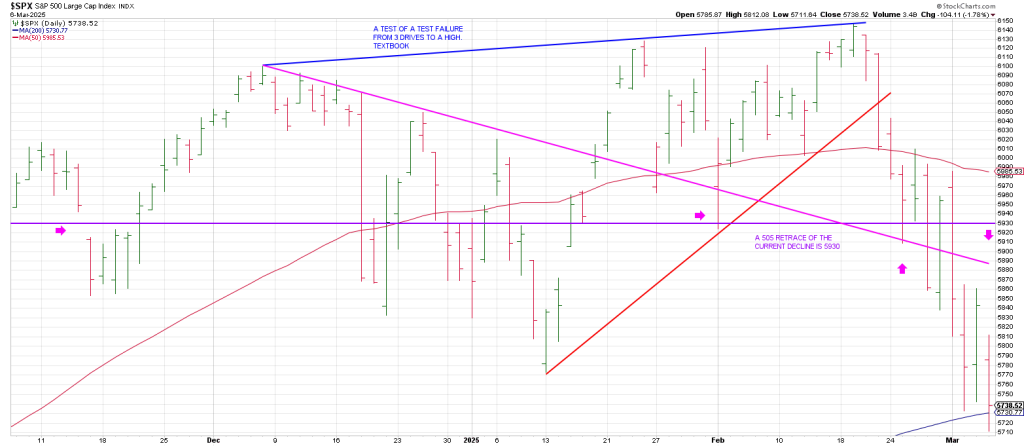
The market had been in a wide and loose trading range a high struck on December 6. The first time the SPX had seen 6100.
It Pinocchio’d 6100 briefly on January 23/24.
On February 19th the SPX attempted another breakout.
The index stretched to the aforesaid 6147 closing at the top of the range that day.
It was the third and last foray above 6100.
The old bromide that markets play out in “threes” is more than just a saying.
The Feb 19th high satisfied the third touch of tops line from the initial December 6 touch of 6100.
So while it didn’t look like a panic was lying like Freddie Krueger under the surface of momentum stocks pirouettes to new highs, my cycle work was sounding an alarm.
The Gann Panic Window opens 40 calendar days from a high.
This was the last rally pivot high (not all-time high) in 1929 and 1987 .
The 40th calendar day from the January 24h orthodox high in 2025 is March 5th.
On March 4th, the SPX grazed its 200 day moving average for the first time since October 2023.
This week, yesterday we saw indiscriminate selling.
Names include TEAM that had a huge Breakaway Gap on January 31.
TEAM triggered a Jump the Creek sell signal below the gap yesterday producing a large Expansion Pivot sell signal below its 50 day moving average.
CYBR produced an Expansion Pivot sell signal as well.
NET a short idea for Thursday triggered a Jump the Creek sell signal earlier this week.
I used it as a short because it looked like a trip to the 50 day line was imminent.
PLTR another momentum darling, triggered a Jump the Creek sell signal earlier this week and looks set to test the last swing low at 65 region.
EAT is another momentum name that triggered a Jump the Creek sell signal …on Feb 20th.
What all these names have in common is that they had Exhaustion Gaps leading to climatic highs.
The SPX flushed the 200 day in late October 2023. It recaptured it on a Breakaway Gap on November 2nd and a run for the roses started.
The 40th calendar day from high in 1929 was October 14. The first of 3 crashes that October occurred on Oct 24.
The 40th calendar day from high in 1987 was October 4, the last pivot high before the rollover.
In both instances the crashes occurred around the 55 day from high. A Fibonacci number.
In 2008 there was a secondary high on May 19th. An initial crash low occurred in early July around 55 days later.
Another break started in late September 2008 with a crash bottoming on November 20-21.
The volatility in that second crash in 2008 was off the charts—huge up days followed by huge down days. It mirrored the pattern in 2020 to some degree except that 2020 was more compressed.
One never knows exactly what will spook the herd. With cycles we can know that the herd was setup to be spooked.
While many well-known technicians were looking for a continued melt-up throughout 2025, we differed.
That has made a big difference.
While everyone is blaming Trump’s Tariffs, the news breaks with the cycles.
Trying to trade headline to headline will get you chopped up.
You need to know the most likely pattern that the Cycle will produce.
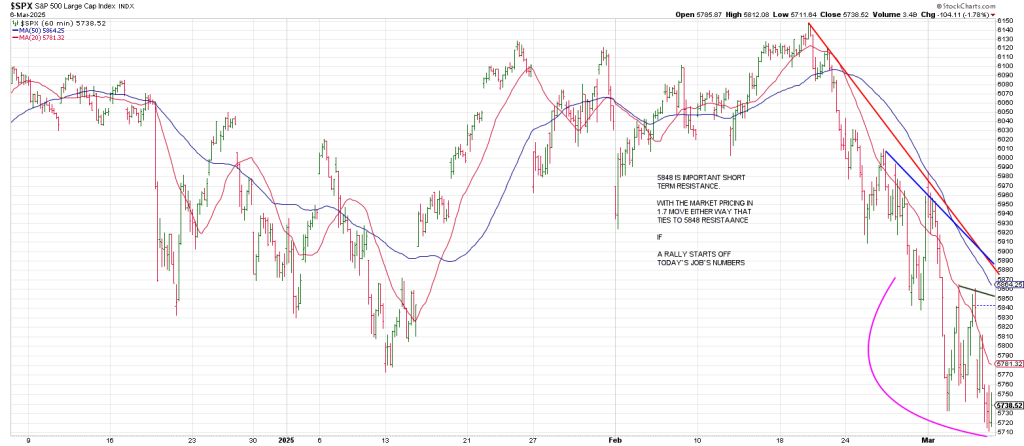
The market is pricing in a 1.7% move off todays Jobs Report.
Last night AVGO reported and rallied sharply.
It’s going to be another Volatility Lollapalooza.
In sum, yesterday was another session of heavy selling, the DUKA dropped 405 points, the SPX fell 104 and the NAZ lost 575.
The Magnificent 7 were no refuge and have become the Maleficent 7 as there is no place to run, no place to hide.
Notably, four of the seven fell more than 3.5% each.
The SPX has now shed over 400 points or 7%, in just the past eleven sessions.
That’s clearly a mini-crash.
Is this just a shot over the bow of the USS Bull?
Will the real crash unfold following breakage below the Maginot Line?
To recap I’ve been calling last summer’s highs of 5650 to 5670 the point of no return.
This ties to the 5685 ‘cube’ down from high.
If prior resistance, the summer highs, fail to act as new support, it will open the door to the scene of the crime, the August low of 5119 where the blow-off started.
Given the sharp and rapid decline, the market is ripe for a counter-trend rally courtesy the Jobs Numbers…in the spirit of “wax on, wax off”.
While the Primary and Intermediate trends remain decisively lower, bear market rallies often produce some of the most powerful short-term rebounds.
History offers plenty of examples, from the sharp 1 to 2 day surges in 2008 to the short-lived rapid counter-trend rallies of March 2020.
Whether a bounce occurs today or after further declines is uncertain, but when it comes you will know it because there will be a chorus of talking heads proclaiming that the worst is over and a new bull market is underway.
An hourly SPX shows 3 drives to a possible short-term low that could produce a rebound to the declining 50 hour moving average.
That said, the SPX has a date with 5685 which is 540 degrees down.
A word to the wise: believe what you see until proven otherwise. That is to sell the rips.
Bear market rallies are part of the broader downtrend and should be viewed and used accordingly.