“Karma police, arrest this man
He talks in maths” Karma Police, Radiohead
“A boom/bust process occurs only when market prices find a way to influence the so-called fundamentals that are supposed to be reflected in market prices.” George Soros
“Patterns of price movement are not random. However, they’re close enough to random so that getting some excess, some edge out of it, is not easy and not so obvious.” Jim Simons
The hallmark of the SPX advance from the October 2022 low is the shrinkage in volatility.
Since MARCH a reversion to the mean has erupted.
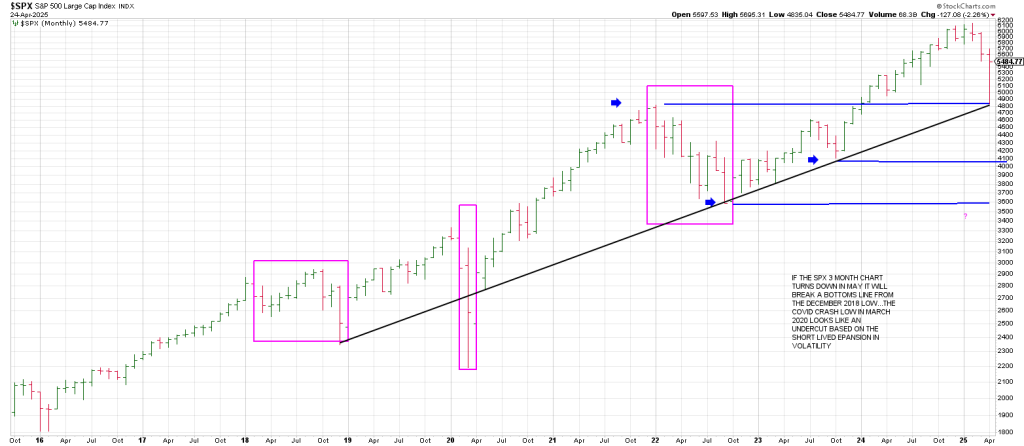
Following the contraction in monthly volatility in 2017, a reversion to the mean occurred into 2018.
Following the contraction in vol into early 2020, another reversion to the mean erupted in March 2020 that led to a stretch of volatility contraction into January 2022.
Another reversion to the mean occurred as the volatility regime reigned throughout 2022.
From the Oct 2022 low volatility hibernated again …until March 2025.
Is two months enough to quell the Medusa of Vol?
In 2018 volatility writhed for a year.
In the spring of 2020, it was 2 months.
2022 saw 9 months of reversion to the mean.
I think March 2020 was the exception, not the rule. It was Covid and the Fed poured gasoline on the money pit.
That looks unlikely here as they are tariff-ied.
So far we are only two months into the current breakout in volatility.
The analysis below of what we are facing by Molson Hart the founder and president of an educational toy company called Viahart dovetails with why I think the SPX/QQQ is putting in an interim Top.
The White House has put itself and the country in a bad situation but doesn’t realize it yet.
Around April 10th China to USA trade shut down.
It takes ~30 days for containers to go from China to LA.
45 to Houston by sea, 45 to Chicago by train.
55 to New York by sea.
That means that there are no economic effects of what was done on April 10th until about May 10th.
Around that time (it’s already started to happen) trucking work is going to dry up. Warehouses will start doing layoffs because no labor is needed to unload containers and some products will be out of stock, reducing the need for shipping labor.
All this will start in the Los Angeles area.
After about 2 weeks, it’ll start hitting Chicago and Houston.
Let’s say the White House, after 3 weeks, changes its mind, on May 31st.
“This isn’t working out like we thought it would. Tariffs back to 0.”
Let’s say China says “bygones be bygones, we’ll go back to how things were”.
Let’s say every factory in China that got screwed by their orders being cancelled says the same thing “no problem, we’ll make and ship”.
The problem is, even under the most favorable conditions of China and the factories restarting economic ties as though nothing happened, it will be at least another 30 days before economic activity is revived.
And that’s just in LA.
In Chicago/Houston, you’ll need to wait another 45 days.
New York, at that point, will still be getting containers from before April 10th, they will then have 50 days (May 31 minus April 10) of zero economic activity at the ports, in trucking of Chinese goods, in warehousing.
The whole situation is a bit like lockdowns. Once you shut down, it takes a long time to get economic activity back to where it was, if you ever can.
And again, this assumes, that China and its factories, which make things you can’t buy elsewhere, will start right back up again as though nothing happened, which is unlikely.
It’s almost like we’re speeding towards a brick wall but the driver of the car doesn’t see it yet.
By the time he does, it’ll be too late to hit the brakes.
The news breaks with the cycles…and the patterns.
Yesterday we spoke about the really big cycle.
Let’s look at the pattern.
Below is a daily SPX from last August.
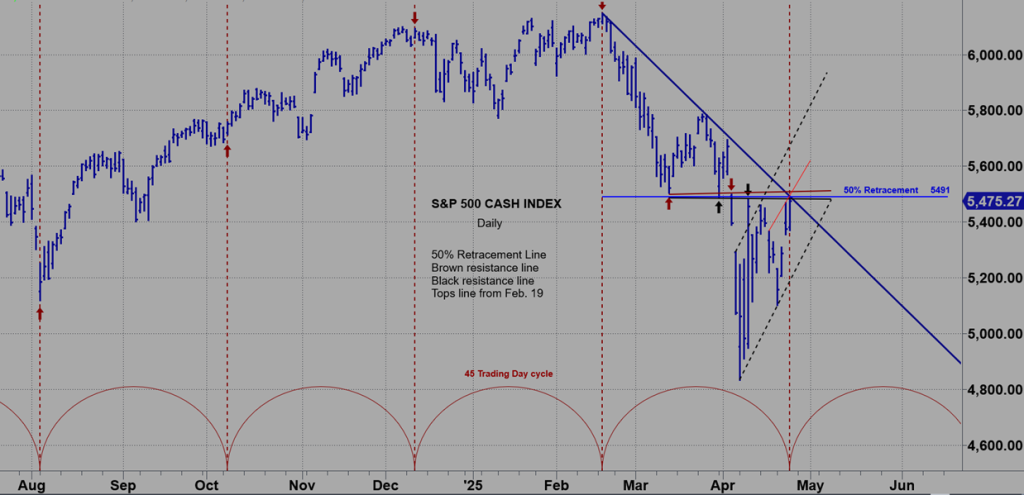
The SPX is at:
- The 50% Retracement Line
- The horizontal resistance line which ties to the broken double bottoms: March 13 and March 31st. How important was that ‘double bottom’? The breakage saw the SPX drop apx 665 points in THREE DAYS.
Talk about Gann’s Law of Vibration…this ties to the SPX price low where the bull started in MARCH 2009.
The 3 day plunge is another great example of the 3 Day Rule and how markets play out in threes. - The black resistance line is a Tops Line from the Feb 19th all-time high
Now notice the 45 Trading Day Cycle from the August 2024 waterfall low that comes in right now.
This is the 4th iteration of that 45 day trading cycle for 180 trading days…an opposition.
To recap,
We have a 50% Retrace
A backtest of double bottom prior horizontal support/resistance
And declining Tops Line resistance.
In addition the SPX looks like it’s working on an A B C corrective countertrend rally.
The A wave is the rally up from the April 7th low.
The B wave is the pullback into Monday April 21st.
Theoretically we completing the C wave.
Markets seek equilibrium.
This years decline to 4835 is a 50% retrace of the October 2022 low to the February 2025 high.
The advance from the 3491 October 2022 low to the 6147 Feb 2025 high is 2656 points.
Half that range is 1328 points, added to the 3491 low is 4819.
Virtually a direct hit with the early April low AND the January 2022 peak of 4818.
Got geometry.
We need to be mindful of the current 50% retrace which is 5491.
Thursday the SPX closed at 5485.
The bottom of the gap window from the massive April 3 Breakaway Gap is 5571.
Today squares out with 555/556 or 5550 SPX.
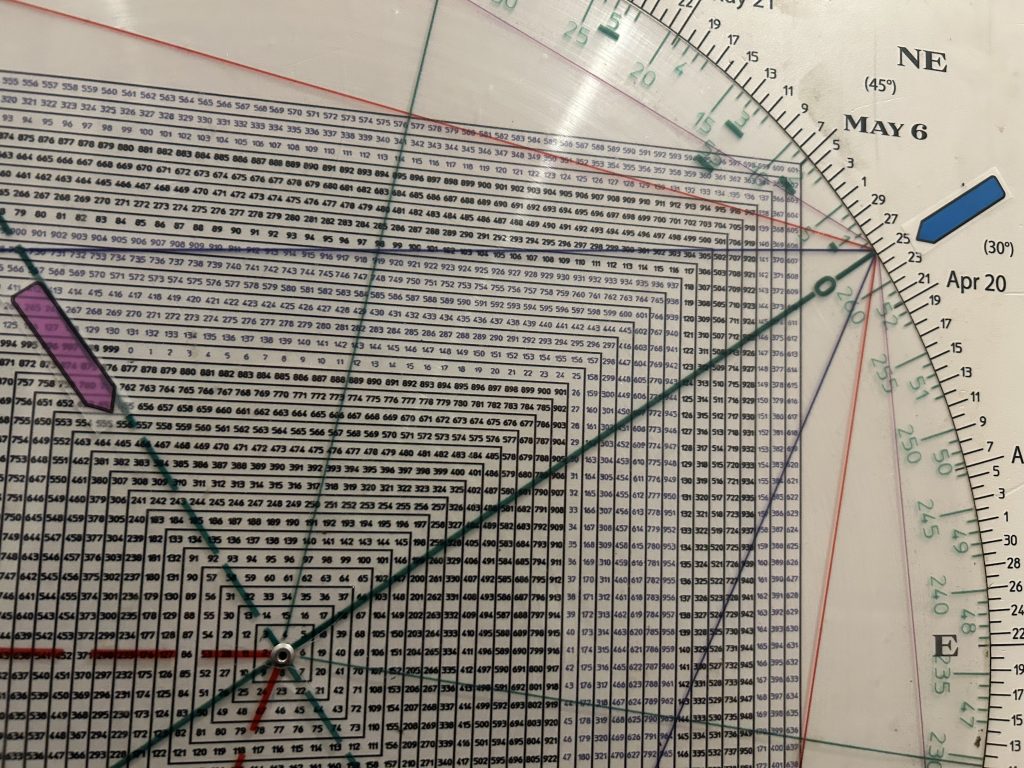
If the index can push over the 550 SPY strike it could open the door to the 555 strike for today’s OpEx Pinball.
While this weeks rally likely has many market participants embracing the idea that Monday was a successful test of the early April low, the SPX shows TWO drives to a low, not THREE.
The normal expectation is to see 3 Drives to a Low (or high).
Below is a daily SPX from 1998 juxtaposed with 2025.
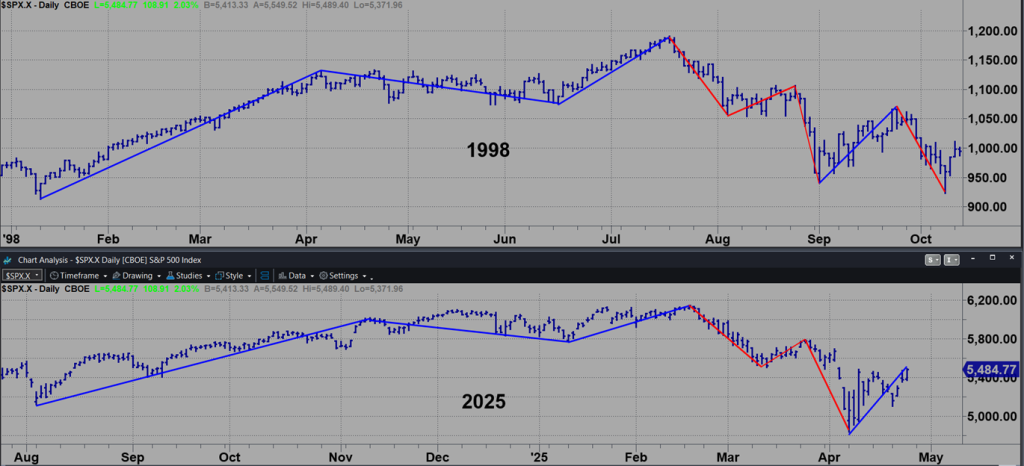
The analogue is compelling. 1998 shows 3 Drives to a Low in October 1998.
This was the low that launched the final fling into MARCH 2000.
Notice how the pattern to date in 2025 lines up neatly with 1998.
We seem to be at the pivot high of the last blue uptrend line from 1998 before a leg down and a new low for the move.
Notice that the entire downdraft in 1998 was approximately 90 days/degrees.
From our Feb 19th high in 2025, a 90 day/degree decline ties to May 19th…near the anniversary of the NYSE.
That’s the bull case.
In the past 15 trading days the SPX has seen runs of:
-12.1% in 4 days
+9.5% in 1 day
-5.5% in 7 days
+6.3% in 3 days
If an interim top is being struck, a 3rd Drive to a Low to only the April low we’re talking about 13%.
A 3rd drive should go lower.
But given the volatility regime and that late May is a month out, it’s not out of hand to think that a drive to 4100, the October 2023 low, is on the table.
That represents a decline of 1400 points from current levels, or around 25%.