“I try to ignore what the paper says
And I try not to read all the news
And I’ll hold you if you had a bad dream
And I hope it never comes true. It’s a Dream, Neil Young
“By studying past price record you will be able to prove to yourself history does repeat and by knowing the past you can tell the future. By studying time cycles and time periods you will learn why market tops and bottoms are found at certain times, and why resistance levels are so strong at certain times, and prices hold around them.” W D Gann
They say to know where we are, we have to know where we’ve been.
Or as Maya Angelou said, “You can’t really know where you are going until you know where you have been.
Where we have been in the last 15 years is a dream.
It’s a dream in the market in the sense that it has shut out the normal 5 year bull markets.
For example 1932 to 1937.
1982 to 1987
1995 to 2000
2002 to 2007
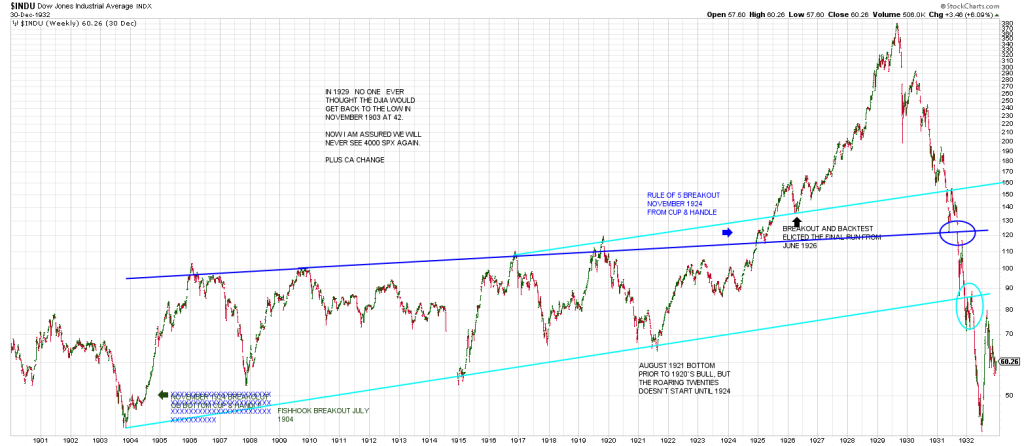
Even though they call it the Roaring Twenties, in reality the big bull run in the 1920’s was the 5 years from 1924 to 1929.
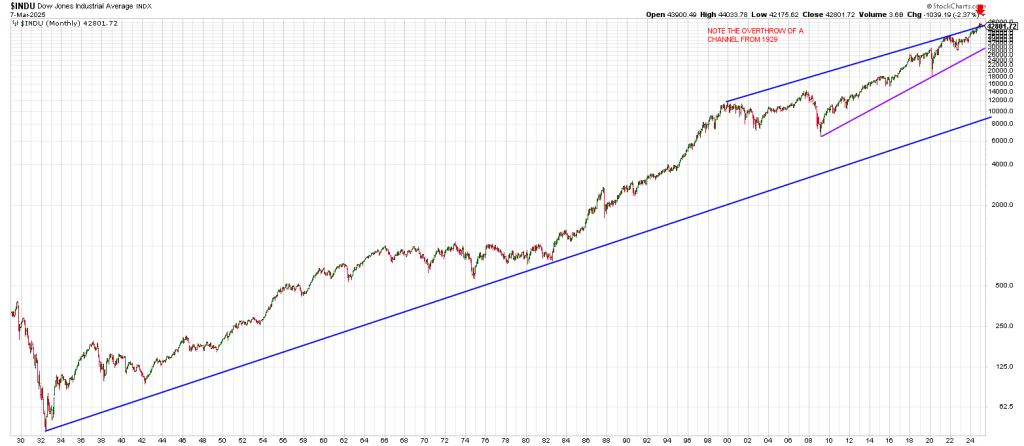
Here we are 5 years from the 2020 crash.
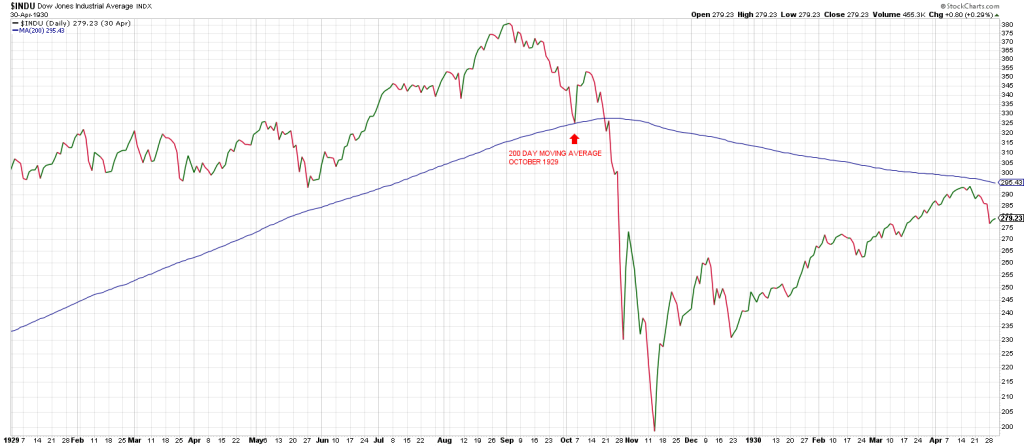
After the 1929 crash took the air out of the bubble, the market rallied 5 months into April 1930.
The real damage was done from there.
I say that because I suspect that most investors believed things were back to normal—that the coast was clear. That the prior strength would be revisited.
Momentum is the mother of complacency.
So worse than losing money on the way down, folks bought all the way down after the return rally into April 1930 looking for Miss Momentum to be revisited.
Instead, they got Kay Bar the Door.
She’s a runaway bride from Mr. Momentum.
We are 95 years from that Spring 1930 top.
That is 19 five year periods.
19 is the Metonic Cycle (19 years). This is when the phases of the moon repeat on the same dates of the solar year.
In his coded novel Tunnel Thru the Air, Or Looking Back From 1940, W D Gann points to the significance of the moon in two ways.
1) We have already noted that 19 is the Metonic Cycle linking the sun and the moon.
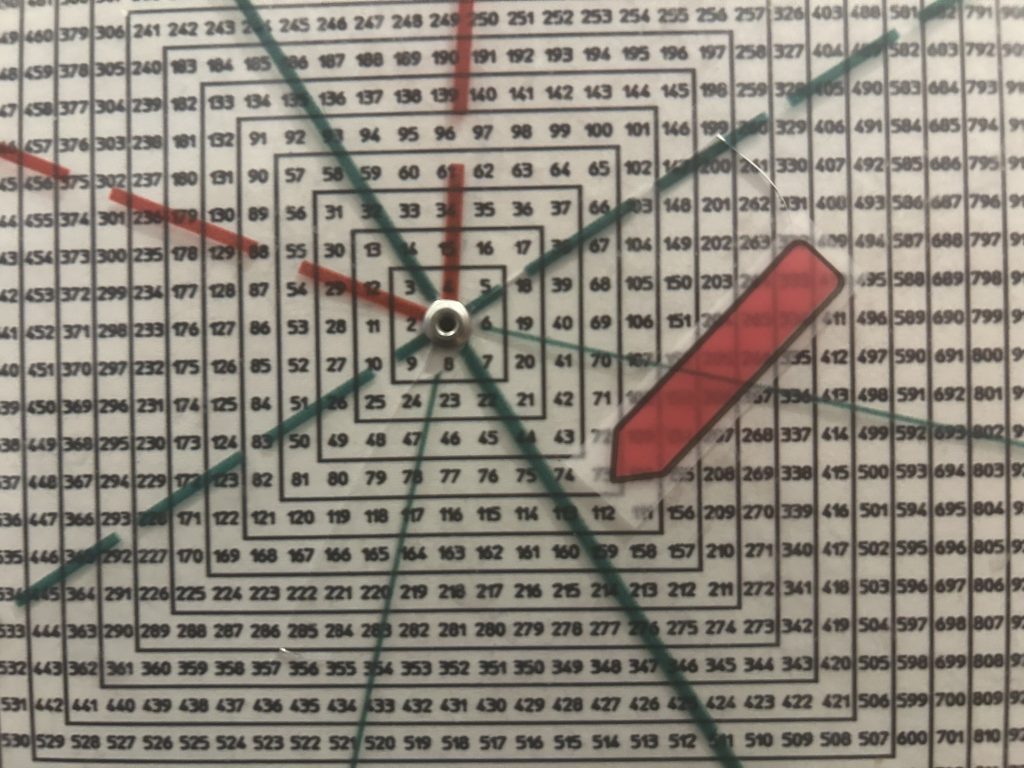
However, I will explain what I’ve never heard anyone reveal before. On the Square of 9 Wheel looking back from the numbers 19 and 40 is the number 69.
69 is the symbol for Cancer, ruled by the moon. Gann is pointing to the moon.
2) The numbers 19, 40 and 69 are on the same axis that points to March 21st, the Spring Equinox, the natural beginning of the year. Every year the Sun is at zero Aries, the first sign of the zodiac on March 21st.
What Gann did with this stunning ‘code’ is connect the moon and the sun…the Metonic Cycle of 19 years.
3) On page 69 in Tunnel Thru The Air, Gann talks about what you need to know to tell the future. Clearly Gann is pointing to the moon (69 being the sign for Cancer ruled by the moon) as the ancients told time by the moon or moonth (we tell time by the sun).
We have proved in our projections for intraday turns given on the Hit and Run Private Twitter Feed, using Moon Phases, along with short term cycles and fractals, the significance of Moon Phases catching short-term and big picture turning points.
Again to recap, we are 19 of these 5 year periodicities from the Spring of 1939.
Is it possible? Is it possible another crash is on the table?
Clearly many big stocks have crashed already.
For example:
TSLA is down nearly 50% in just under 3 months. That’s a crash.
CAVA is down more than 50% since its November 13th peak (we’re not picking on tech here)
DUOL is down from 441 on February 18 to a low of 268 Friday when we alert members on the Hit and Run Private Twitter Feed to a long side play late in the session capturing 10 points.
PLTR is down 45 points (from 125 high) in 13 days.
HIMS a recent momentum play is down from a high of 73 to 32 in 12 days. That’s a crash.
TEM another momentum play has been cut in half from a high of 90 on February 14th.
And the Madam, NVDA, has shed a lot of weight…losing 53 points from its January 7th 153 high.
When they raid the house they take the Madam and the piano player.
Who is the piano player?
The pied piper (to mix metaphors) for animal spirits has been Bitcoin.
Bitcoin ramped from 56,000 in September to 111,700 in December.
A 90 + day blowoff. Just like equities in 1929 and 1987.
It was a neat 100% blowoff.
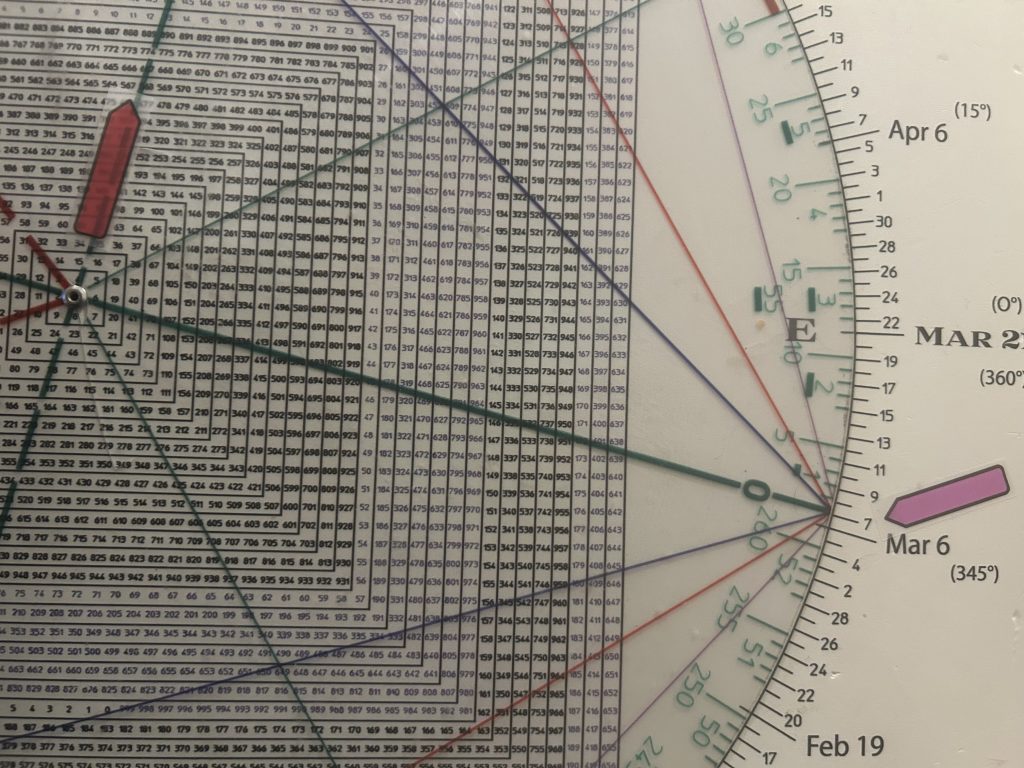
Last month we projected a drop to 74,000…at least…based on the Square of 9 Time/Price Calculator below.

Square of 9 Wheel
Purchase your own Square of 9 Wheel. Shipping to US only. Contact Jeff for shipping outside the US.
Below 74,000 it’s a come to Jesus moment for the Bitcoin bros.
Bill Smead writes, “it is the most all-encompassing momentum market of my 45 years in the investing business.”
Momentum is the mother of complacency.
The Complacency Kids have been scooping up every dip like it’s ice cream since the 2009 low.
No one thinks another 1929 crash is possible.
First, the market can do anything . It’s the short straw but to say it’s not possible is a day dream.
First of all the Inflation Genie has the Fed in a box. When/if they act we will already have crashed.
If the Street is betting on the Fed Put when the Fed is not so fond of Trump is prolly not a good bet.
The SPX tested its 200 day moving average on Friday.
In so doing it tested what we’ve been calling the Maginot Line for months.
This is the 2024 summer highs at 5650-5660.
Friday’s low for the move is 5667.
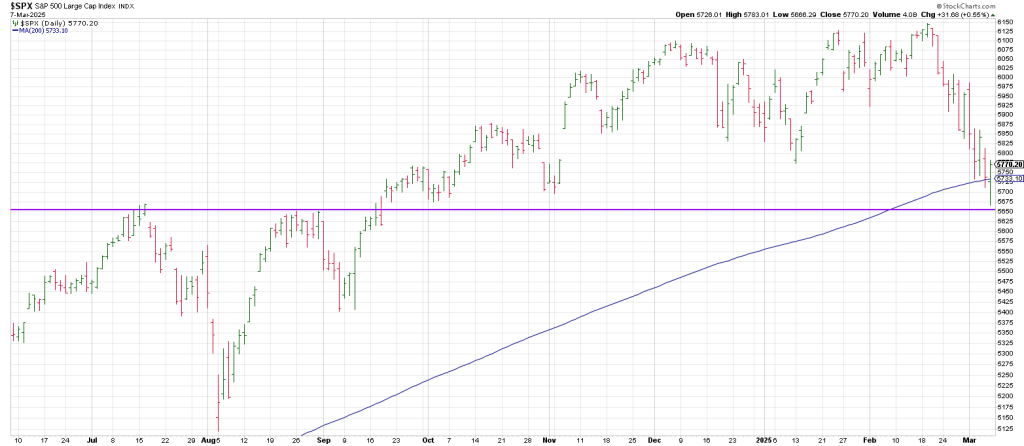
At the same time the SPX cubed out from its all time high in satisfying 540 degrees down at 5685.
Additionally, 567 squares out with March 7th.
The SPX slid to 5666 (567 moving the decimal point to work with the Wheel and rounding).
We alerted members to buy ODTE calls for Friday’s expiration shortly after Friday’s low when the market started to turn.
The SPX ran up 116 points in 2 ½ hours.
That is the power of the Square of 9 Wheel.
So the SPX is doing “The Dance” at the 200 day moving average.
The first move down to the 200 typically acts as support for a bounce of some degree.
In a bull market the 200 day usually sees a test/undercut that defines a low before a new upleg.
That’s what happened in October2023.
In a bear market the first time down to the 200 day typically sees a knee jerk upsidereaction.
Then a break.
I call it the Ice Man.
Mr. Market is on the middle of a small lake, where there is thin ice (thin A/D Line). The ice cracks and he falls into the icy water below the 200 DMA.
He tries to lift himself up and is almost up and out when he falls back but can’t pull himself out, looses his strength, and falls back into the brink.
When the market turns back down thru the 200 in earnest it a point of recognition.
In 1929 the DJIA tested the 200 dma in early October, bounced and then gapped below it starting the Crash of ’20.
In 1987, there was no bounce before the crash.
The SPX tested the 200 day ma on Thursday October 15th, 1987, closing marginally below it.
On Friday it opened below the 200 dma and slid.
On Black Monday, the 19th of October the SPX opened more or less flat and turned into a snowball from hell.
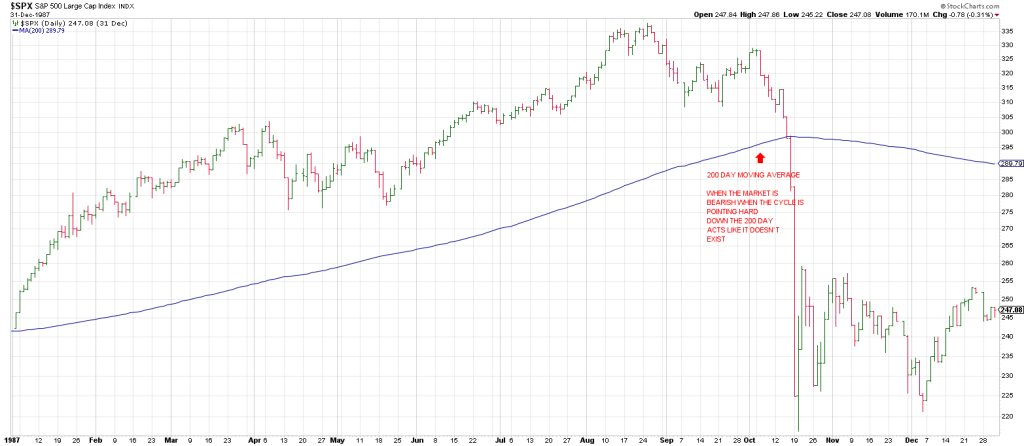
The moral of the story, don’t trust that the market is stable just because of a flat (or up open for that matter) as a tell for the tape for the day when the trend is down and you have continuation below the 200 day moving average.
When the Cycle is pointing down hard, the 200 day ma. acts as if it doesn’t exist.
The SPX tested its 200 day moving average on Thursday.
Friday the market rallied briefly on the jobs numbers and then sank…satisfying the aforesaid important levels of 5865 (540 degrees down from high) and the 567 Time/Price square-out.
Sunday the futes were down as much as 66 points, translating to a slight undercut of the 200 DMA in the cash if that’s where the market opens.
This is the point of recognition, the 200 DMA in tandem with the summer highs.
Whether the market stages a multiday advance above the 200, or an immediate flush of the 200,
This is the point of recognition when traders/investors will run to sell if we get clear cut breakage below the 200 dma.
It’s hard to imagine more indiscriminant, urgent selling in many big names than we’ve already seen.
Take NVDA for example.
A daily NVDA looks terrible.
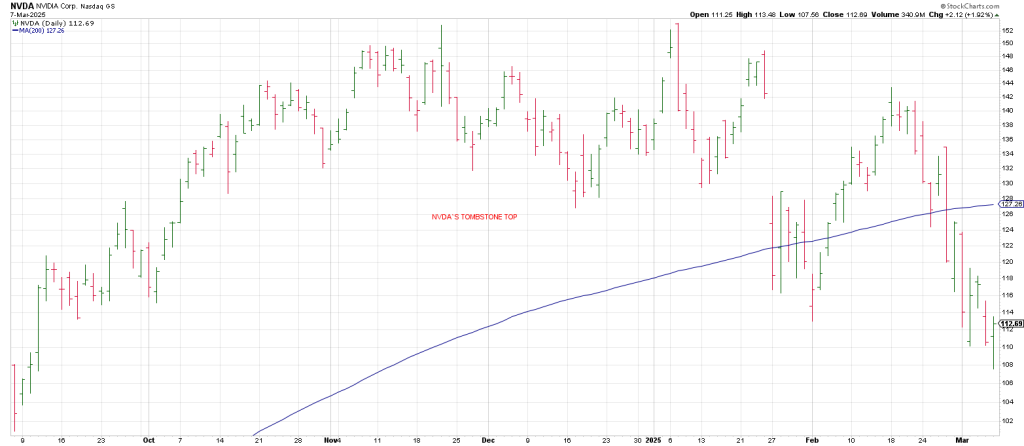
But when you pullback the lens on NVDA it looks like the decline has just begun and it could get cut in half from here.
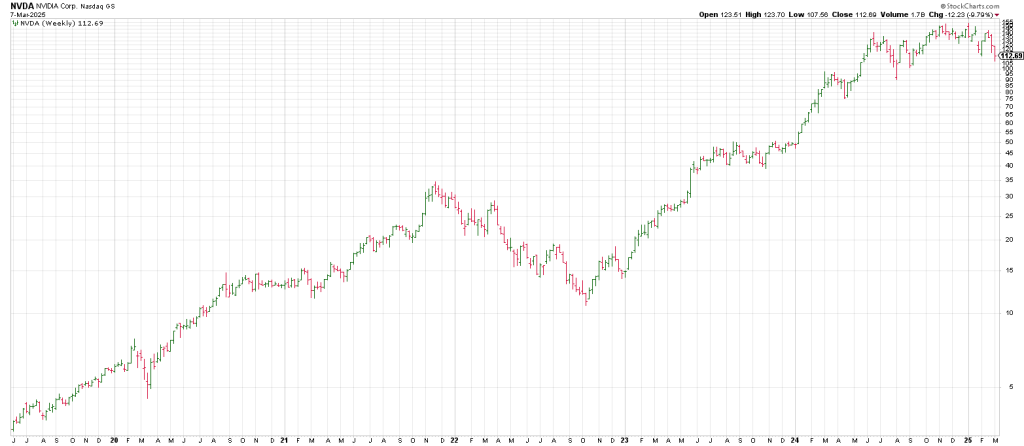
Tomorrow we will walk through NVDA in detail and compare it to CSCO, the darling in 2000.
In sum many traders, particularly Greenhorns too young to have ever experienced a bear market, appear to be buying each step of the way down.
They are doing so because they were mesmerized of the prior strength from the October 2023 low and especially from the August 2024 low.
Players would only buy each step down if they were confident a rally lies just ahead.
You can hardly blame them, this has been more or less the case for the last 16 years.
The success of Buy The Dip has inured the Crowd to the risk when the complexion of the market changes.
And this in keeping with Mr. Markets number one job, to deceive the most players at the most critical time.
The Square of 9 Wheel has a projection for the first stop if the SPX waterfalls below the 200 day moving average in short order which is on our private twitter feed this morning.
Given the accuracy of “The Wheels” forecast for a drop to 5685, my expectation is that this new projection will be met…most like in March because we are in the heart of the Gann Panic Window counting from the January 2025 orthodox high (ie, the Feb 2025 was a Pinocchio).
Calling crashes is a mugs game. But IF the market is inclined to do so, March is when it will occur.
The analogue to 2020 is eerily playing out as projected. Today was to be a gap down after the upside reversal as in early March 2020.
Are the tariffs being perceived as an economic pandemic much as Covid caused a viral pandemic?
The word pandemic stems from the God, Pan. The word panic originates from the Greek God Pan whose sudden presence was believed to cause a sudden unreasoning fear.
There may be reason to fear.
Think about this: in 1929 the dollar was good as gold. No so much today. Note how gold is holding.
In 1929 the U.S. was the greatest creditor country on the planet. Now we are the greatest debtor country.
It’s time to think the unthinkable.