“For the investor who knows what he is doing, volatility creates opportunity.” John Train
“Volatility is a symptom that people have no idea of the underlying value.” Jeremy Grantham
On July 31st the SPX left a Key Reversal Day.
It gapped down the next day following thru below its 20 DMA.
However, the open gap and the 20 DMA were quickly reclaimed perpetuating a powerful rally.
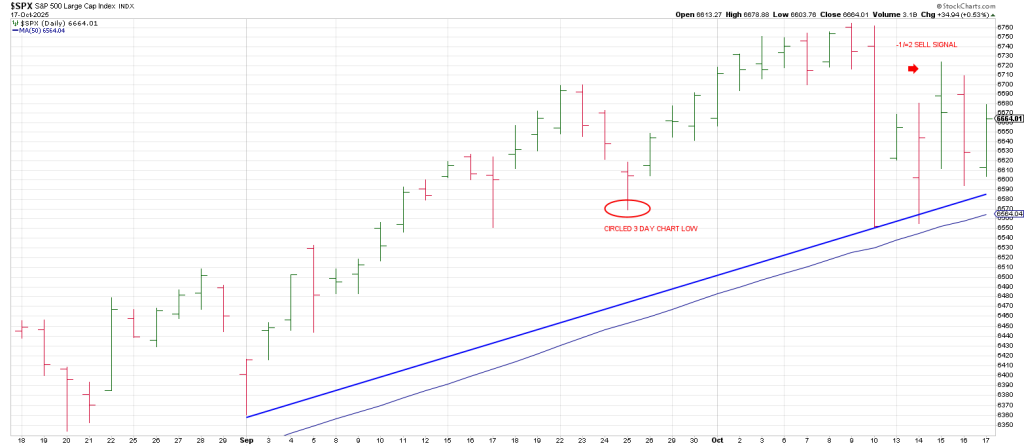
So it’s no surprise that the SPX found support in its October downdraft at a Bottoms Line connecting
the August 1 low and an interim Sept 2 low.
That support line was tested on the Oct 10 plumb-line drop, on Oct 14th and again Friday before the open— based on the SPY action.
Now we have a 3 point trend line which ties to the 50 day moving average.
A break of this support will produce a Combo sell signal: a Rule o 4 Sell (below triple bottoms) and an Expansion Pivot sell signal, the first break of the 50 DMA since the advance off the April low.
The first time the market does something it hasn’t done in a long time, like test the 50 DMA from higher, it typically finds support.
No different this time around.
On Sept 25 the SPX tuned its 3 Day Chart down for only the 5th time since the rally off the April low.
The 3 Day Chart turned back up immediately after the Sept 25 low; however the knife down on October 10 took out the CIRCLED 3 Day Chart low from Sept 25 turning the 3 Day Chart back down.
This is a MINUS ONE in my 3 Day Swing Method.
Following a Minus One any time you get two consecutive higher daily highs it satisfies the Plus Two of
My Minus One/Plus Two sell pattern.
Like clockwork, the SPX rolled over after rallying ‘into the position’ on Wednesday.
Drilling down to the hourlies shows 5 little waves down into Oct 14th followed by what seems to be an A B C corrective rally for a Wave 2
That means a powerful Wave 3 decline should be on deck.
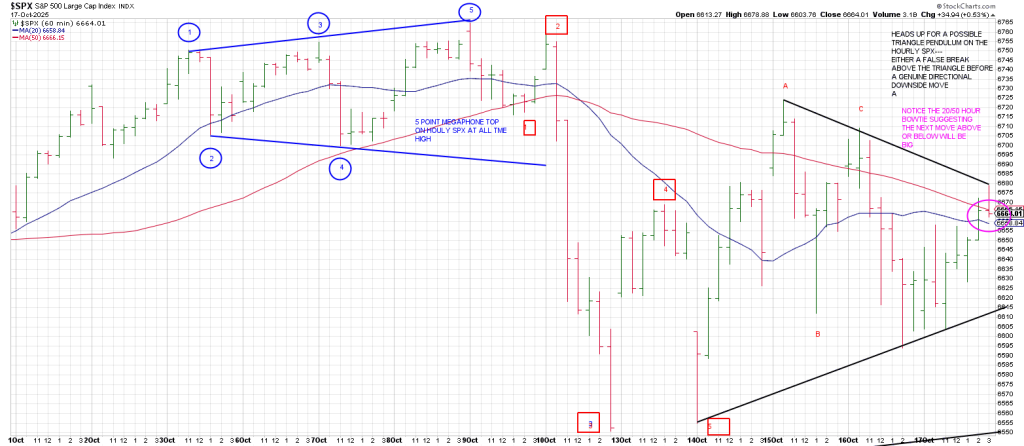
Since the SPX never satisfied a 360 degree decline from the all-time high which equates to 6438
And with a strongly impulsive angle of attack to the downside, defense is on the table.
The hourlies have carved out a triangle an it would not be surprising to see a false break above the triangle that comes right back in an drops below the bottom of the triangle if I am correct about a bearish Wave 2 in progress.
A break out of one side of the triangle followed by a reversal thru the other side of the triangle is my
Triangle Pendulum sell setup.
It follows the idea that fast moves come from false moves.
A weekly SPX shows a stunning Rising Wedge since the April low.
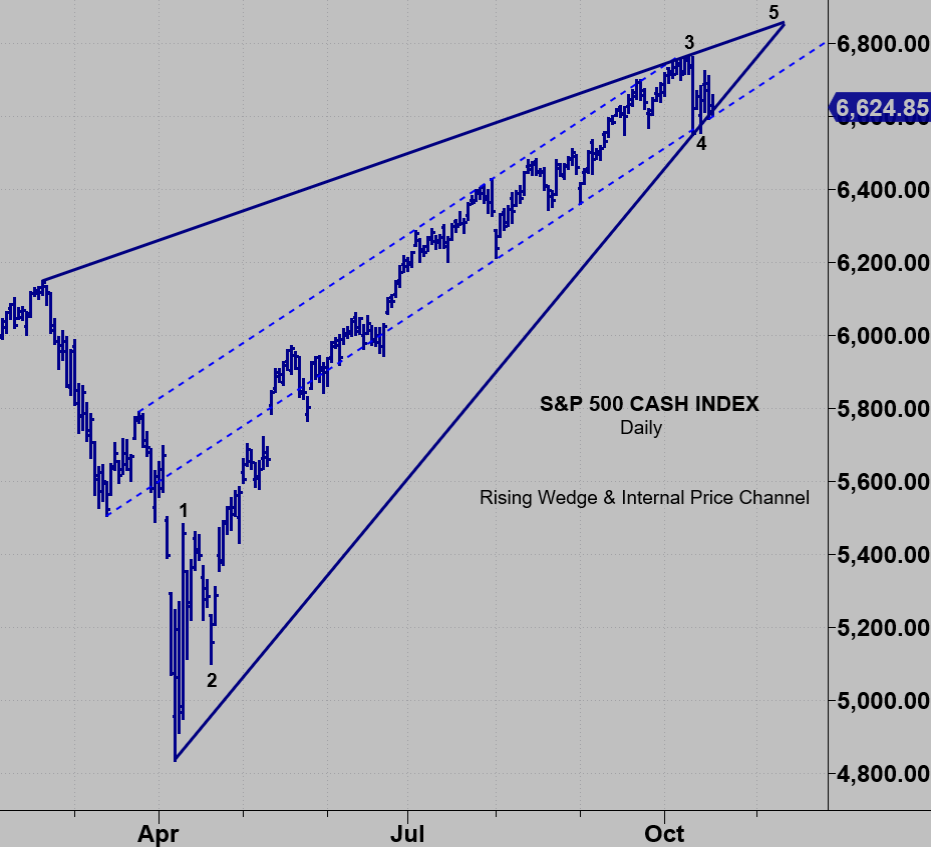
Breaks from Rising Wedges are fast and furious so downside follow through from here must be respected.
Theoretically we could rally to the apex of The Wedge an 7000 but it is not necessary to fulfill the pattern.
IF that is going to play out my expectation is that we drop to the 5750 region first.
Last week we walked through the significance of 5750 ish.
Above show the hourly Megaphone Top on the SPX just before it plunged on Oct 10.
Earlier this month we walked through some historic turning points around Oct 10.
This includes the Bear Market low in 2002 and the Bull Market top in 2007.
Interestingly the big dog, QQQ has a 14 month Megaphone Top.
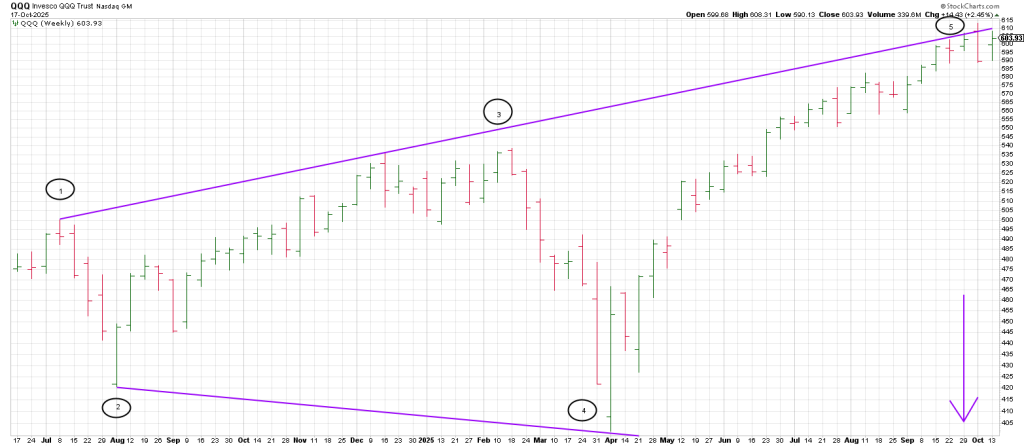
Caution is warranted especially as the Q’s Pinocchio’d the top of the Megaphone before leaving a Key Reversal Week.
In sum the volatility breakout we projected at the end of September is playing out in spades.
It will continue according to my cycle work.
It is eliciting risk off across the board.
The Megaphone Top we showed on Bitcoin at the end of September produced a 23,000 point drop.
It’s not over.
Risk off finally caught up to gold Friday as it dropped nearly 200 from Thursday night’s high.
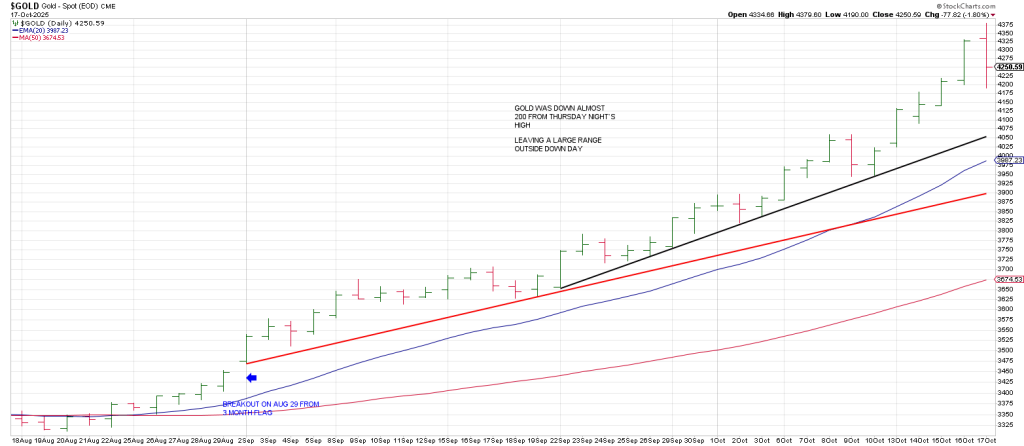
GLD squared-out at its high.
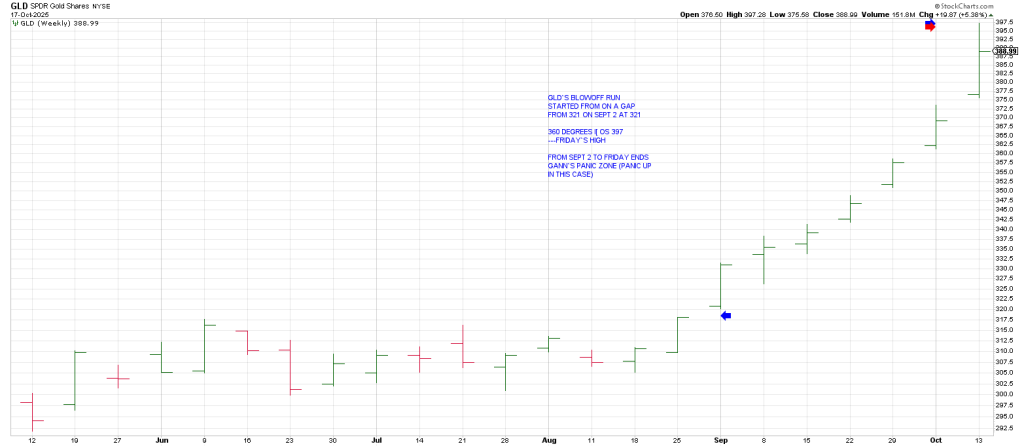
GLD’s blow-off run started from a gap from 321 on Sept 2
360 degrees up is 397— Friday’s high.
From Sept 2 to Friday ends Gann’s Panic Zone (panic UP in this case).
On Thursday we tweeted “watch GDXJ swan dive below 110”.
Why?
The low in GDXJ prior to its parabolic move was 64 on July 31.
112 is opposite July 31st on the Square of 9 Wheel of Time and Price.
The major low on De 30, 2024 was 42.
720 degrees up from 42 is 110.
So between 110 and 112 the expectation is there would be significant resistance.
A 10 min chart shows a little breakout attempt on Thursday.
When it immediately reversed we felt the hook was in.
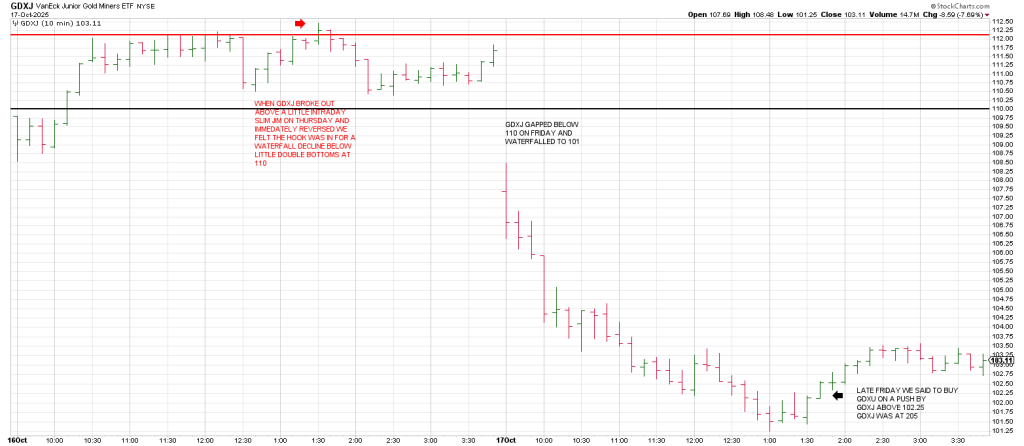
The presumption is that if the little double bottoms at 110 broke GDXJ would waterfall.
On Friday GDXJ gapped with authority below 110 and the die was cast.
It didn’t hurt that it was a monthly Opex.
When GDXJ knifed below the 105 strike it accelerated towards 100.
We alerted late Friday to buy GDXU if GDXJ reversed up through 102.25.
GDXU was 205 when that occurred and it ran to 215.
After the close it pushed to 224 as GDXJ kissed the 105 strike after-hours in a remarkable display of Opex Pinball.

Square of 9 Wheel
Purchase your own Square of 9 Wheel. Shipping to US only. Contact Jeff for shipping outside the US.
In sum, this shapes up as another volatile week but so far price has not dropped as much as would be expected.
A Ketchup Play may be on the table to the downside: slow at first then all at once.
The first week of November is extremely important which we will go through piece by piece in Tuesday’s report.
It’s a barn burner.
If the market rallies sharply into that timeframe and falters, caution is warranted.