“The most money is made when fast moves and extreme fluctuations occur at the end of major cycles.” W.D. Gann
“This wheel’s on fire rollin down the road” They Byrds, This Wheel’s On Fire
There comes a time when a Runaway stock can turn into what I call a Roman Candle.
Runaways typically start with an Expansion Breakout..an expansion above a pattern with a large range.
While in a Runaway phase the ascent is fairly orderly—with stock Bleedback into the prior days range, even if the Bleedback is minimal.
Roman Candles are characterized by Runaway Gaps versus Breakaway Gaps.
A Breakaway Gap occurs when price breaks out of a pattern or zone.
Runaway Gaps are gaps that appear when price is already strongly trending (up or down).
Sometimes a Runaway Stock continues to grind without Runaway Gaps…until the tail end of the move with an Exhaustion Gap.
Many stocks have become Runaways and Roman Candles in recent weeks/months.
Let’s take a look at a few and how to hop on board these speeding trains.
APP left an Expansion Breakout on September 11 and went into a stunning Runaway Move.
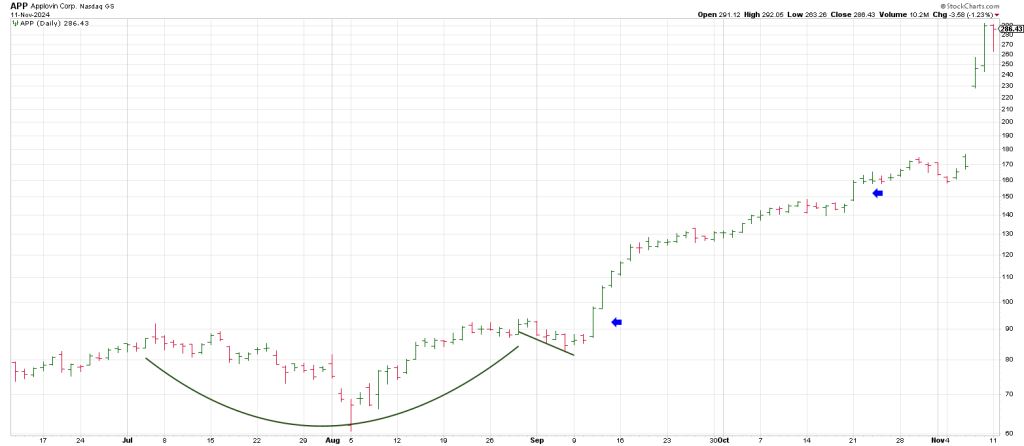
One of the things that tells you’re dealing with a Runaway is that there are typically not more than 2 to 3 days against the trend.
On October 21st APP left another Expansion Breakout.
Notice the alternation in the price action compared to the September signal.
After the October signal, APP did not explode; it went sideways.
Then, for the first time since its August low, APP turned its 3 Day Chart down on November 4th.
The first time a stock does something, take note, it’s talking.
3 Day’s after the APP turned its 3 Day Chart down it reported earnings and gapped up from 168 to
230.
It hit 292 the next day. Last Friday.
On Monday, it was announced that APP would join the NDX.
It was a sell on the news.
As flagged before the open, APP up 12 pre-market was set to open red.
It opened flat and immediately water-falled 29 points in 20 minutes.
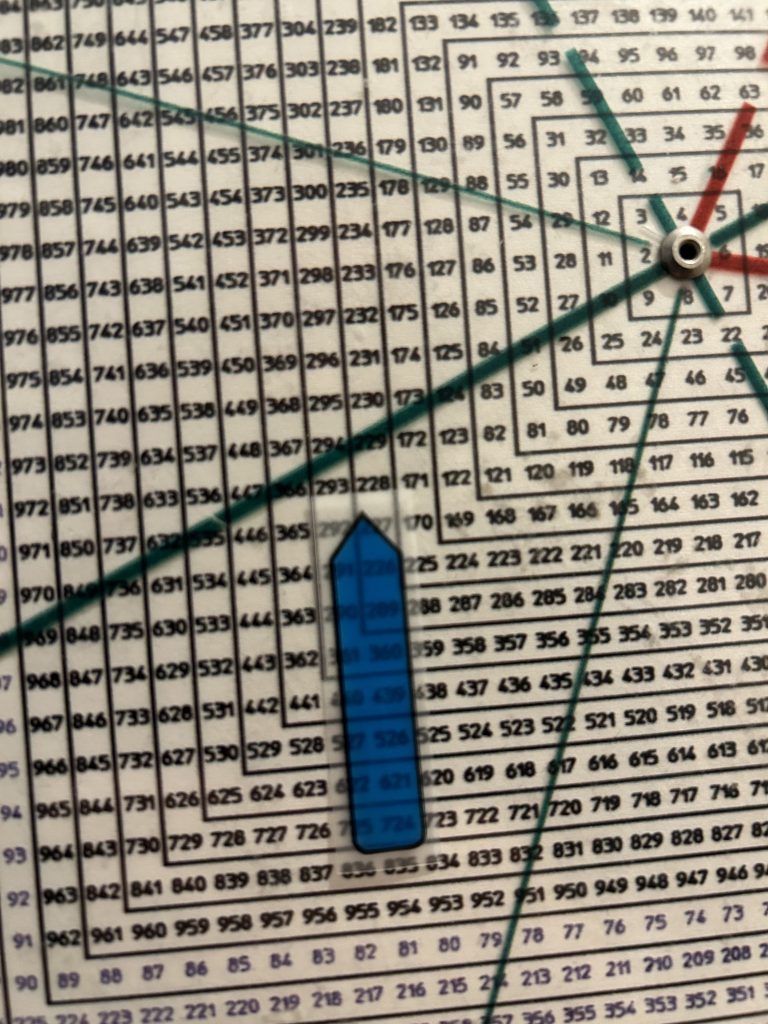
What’s amazing is that Friday’s high close at 290 squares-out with August 5th, the low day.
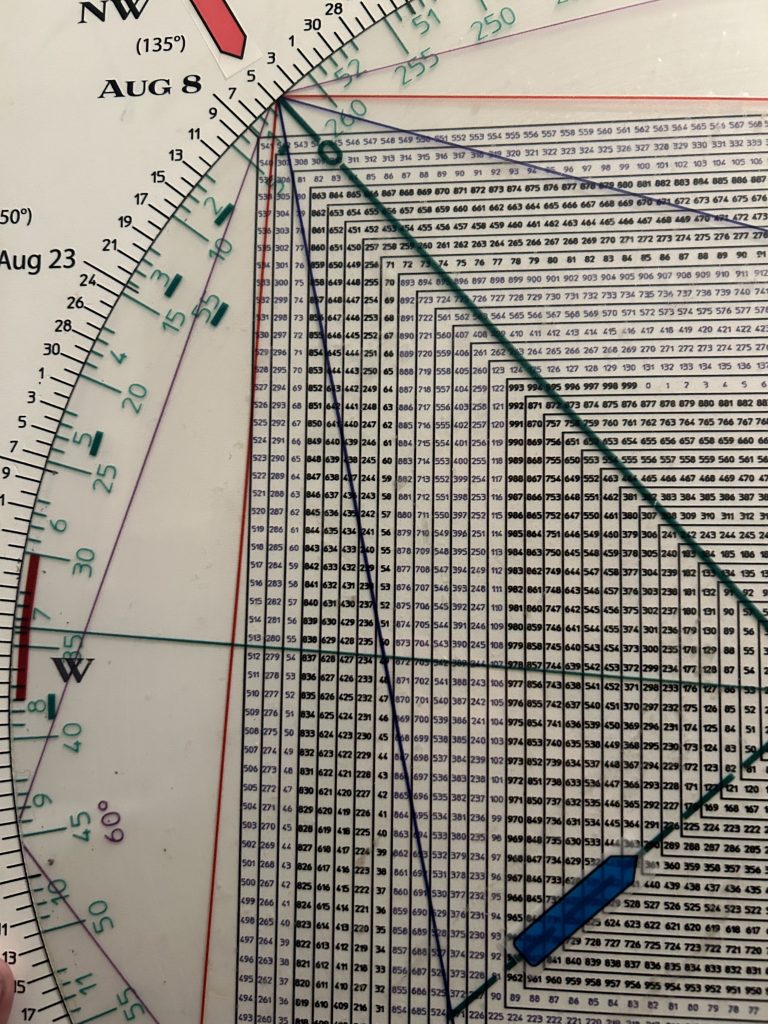
90 degrees down from high is 276,
180 degrees down is 260.
APP plunged to a low of 262 on Monday in 20 minutes.
How about this: 360 degrees down from its all-time high is 228.
That’s APP’s low after gapping up last Thursday…essentially where it opened.
Said another way, using 228 as a pivot opened the door to 360 degree Climax Run.
Hard to buy APP last Friday following the prior days massive up-gap, but the Square of 9 Wheel
Called it.
TSLA had a massive gap up on October 24th leaving an Island Bottom from a Bear Trap low the prior session.
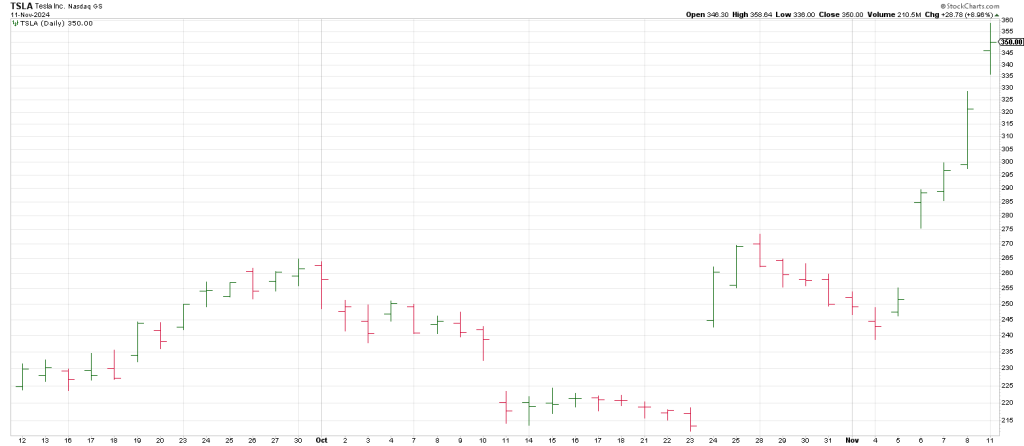
TSLA turned its 3 Day Chart up on Oct 28, at a high of 273.50 immediately following the gap and started to pullback.
What if I told you there was a strong expectation for a pullback from 273?
Why? Because 273 is exactly 360 degrees or 1 full price cycle up from the 212 low.
In other words TSLA satisfied a 360 degree move in 3 days.
Amazing.
On November 4th TSLA turned its 3 Day Chart back down on a test of the 20 day moving average into Phil D Gap. A beautiful Combo setup.
The pullback was 180 degrees in price.
Hit and Run went long TSLA on November 4th.
I wish I could say we captured the entire move.
Notice the Breakaway Gap on November 6th, followed by the Runaway Gap on Monday.
TSLA struck a high of 358i/359 on Monday.
360 squares the 212 low.
As well 359/360 “points to” November 11/12.
One more.
As offered above, not all Breakaway Gaps are created equal.
When they involve a solid pattern , the odds of follow thru are enhanced.
Hit and Run members took TEAM long before earnings on October 31st at 191.
It opened at 225 the next day.
The solid pattern:
It was sporting a classic Bull Flag in the context of a Cup and Handle.
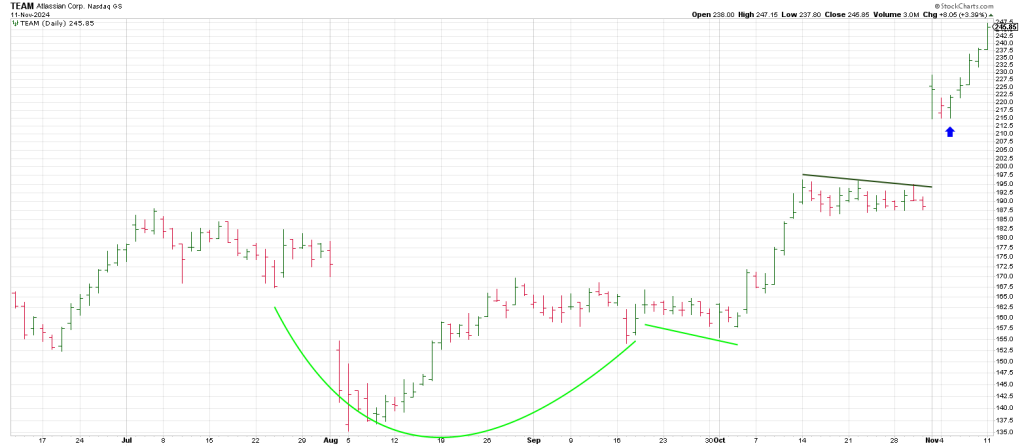
But this was before the gap.
The point being that the massive gap combined with the pattern prior to the gap projected a strong continuation of the rally.
On November 5th on the Hit and Run Private Twitter/X Feed we flagged 215 as a pullback buy as it is 90 degrees down from the November 1st 229 spike high.
I never pulled the trigger. TEAM struck 247 yesterday.
When you see a picture-perfect setup and you don’t pull the trigger, the train seldom backs up to the station to let you on.
AFRM rallied 10 points on Monday following a Bungee off its 50 day moving average on Friday.
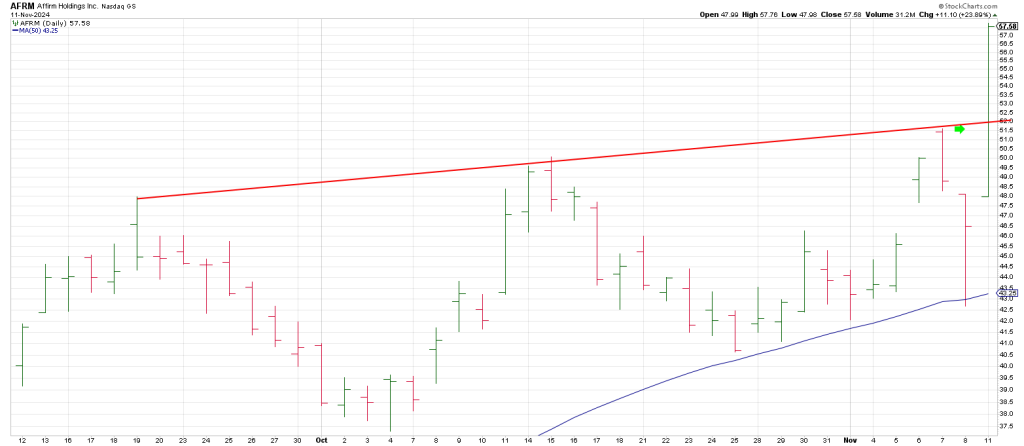
Monday it gapped open and the key to continuation was a 10 minute Cup and Handle pattern starting on Friday.
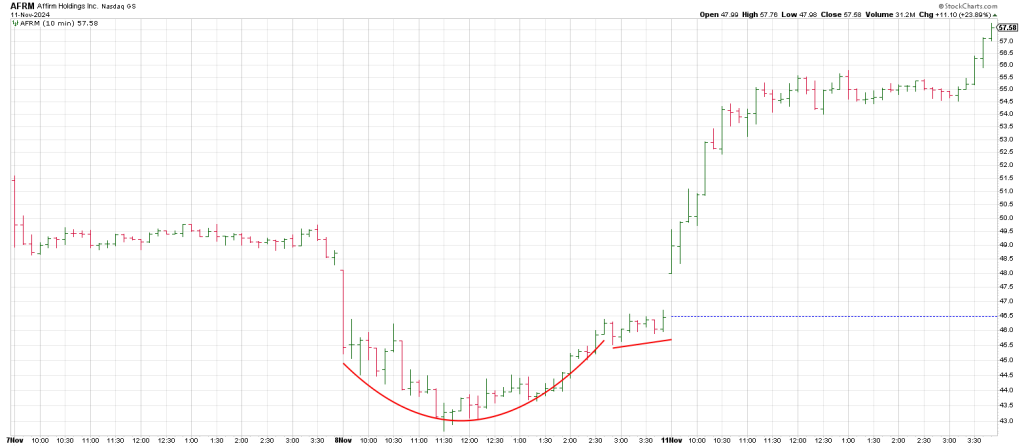
AFRM followed thru with what I call a Gap & Go ORB (Opening Range Breakout).
In other words following the opening gap, AFRM triggered an ORB at 51.10.
It perpetuated an extension to 57.50 on Monday.
Why did AFRM go vertical on Monday?
In addition to the above patterns, it rocketed when it offset Thursday’s signal reversal sell bar.
in other words, clearing last Thursday’s reversal triggered a Reversal of a Reversal. What I call a Keyser Soze.
As well, AFRM broke out over a 3 point trend line (red).
AFRM, the epitome of “fast moves come from false moves.”
Last one.
SHOP reports today.
SHOP gapped out of a Bull Flag at 81.50 on November 6th and is still running, hitting 92 yesterday.
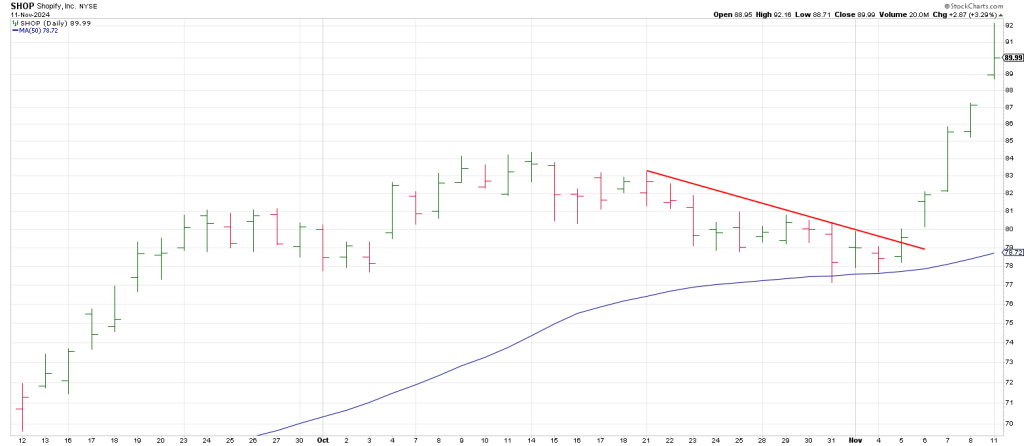
Notice the Runaway gap on Monday that led to an immediate 3 point gain before it consolidated in front of today’s earnings.
It looks extended; however checking the weeklies, shows SHOP came out of a weekly Cup and Handle last week.
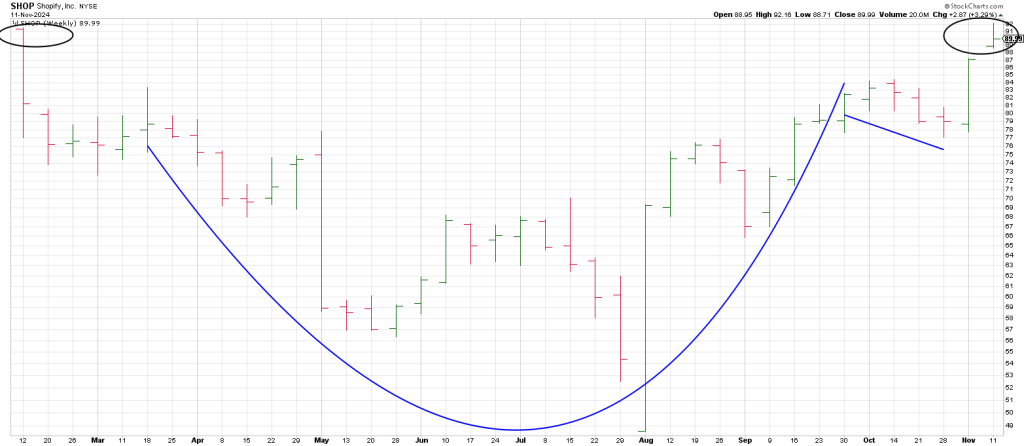
It’s testing the Train Tracks Top in February, so the price action after reporting is going to be pivotal.
Why?
Today squares out with 90 and 48, the August low.
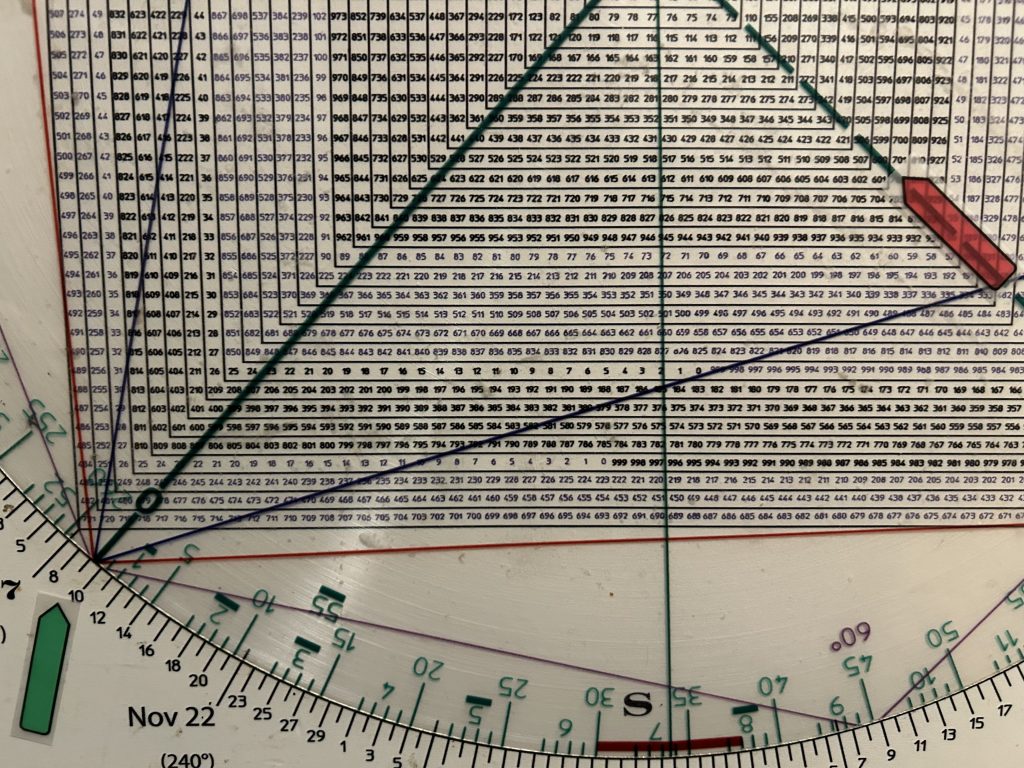
The key to capturing explosive short term moves is multiple time frame analysis, the right strategies, and projections from the Square of 9 Wheel.
As for the market, yesterday Hit and Run members bought short-dated SPY puts for a pullback.
Why?
The SPY struck an all-time high of 600.17.
600 squares out with this time-frame.
It should elicit a pullback…at the very least.