“People generally see what they look for, and hear what they listen for.” Harper Lee, To Kill A Mockingbird
“Look out of any window
Any morning, any evening, any day
Maybe the sun is shining
Birds are winging or rain is falling from a heavy sky.” Box of Rain, Grateful Dead
For all the clamor about the market broadening out and not “needing” the Mags, the SPX has been spinning its Wheels since October 29.
That’s when the SPX scored a record high at 6910 and pulled back meaningfully to 6522 in 17 sessions into November 21 when the index tested its 20 WEEK moving average.
I don’t call it the Holy Grail for notin’
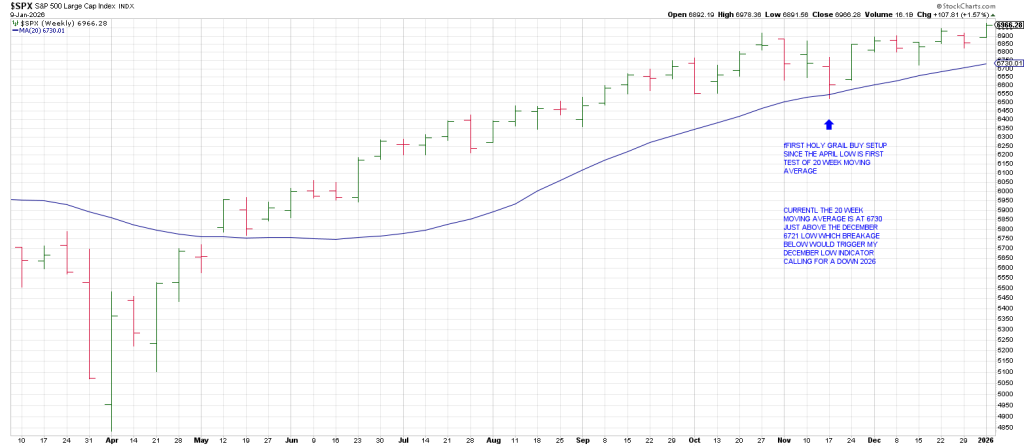
From the November 21 low the SPX rallied back to test record highs quickly …in two weeks into December 11.
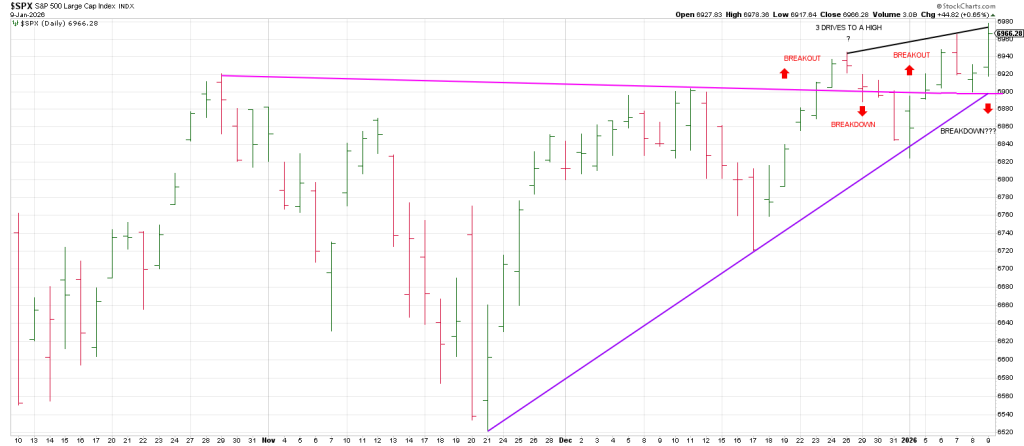
Since mid-December Mr. Market has teased bulls and bears alike.
Was the index poised to breakout of this SEVEN week range or had it put in a double top?
The SPX “broke out” on December 24 and still the teasing continued as the market came right back in.
However the “coming in’ tested its Bottoms Line on January 2 ….and held.
The test of this 3 point trend line and the turn back up above The Line…the 6900 level…got the bulls attention. It didn’t really get them lathered up until a little Friday FOMO kicked in.
So the question is: Will the Second Mouse Get the Cheese or it the cheese laced with arsenic?
I think we get to find out this week.
Why?
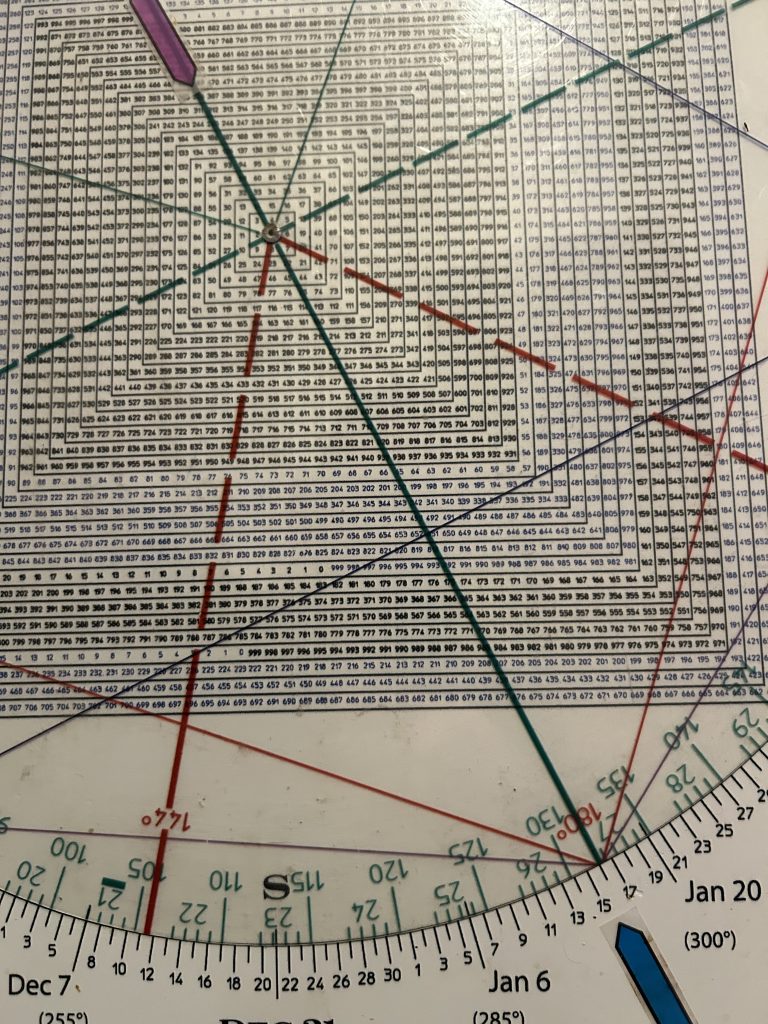
First, Sunday was January 11, the 1973 Fakeout/Breakout high prior to a 50% bear market.
A very important anniversary.
Interestingly the October 29 top was as we know also an important anniversary—the 96th anniversary of the 1929 pre-crash top.
53 squares 96.
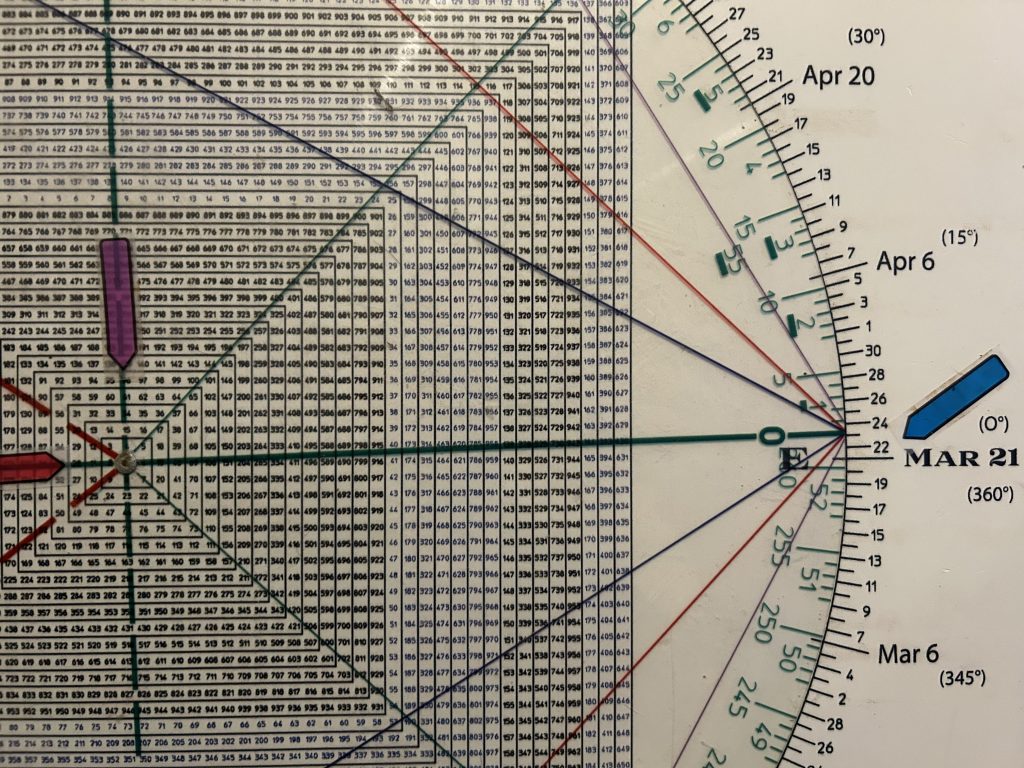
Notice how they square the late March 2000 Bull Market top.
As well this week is opposite 386. This is the DJIA price high in 1929.
It’s bizarre but the day of the high in 1929, September 3, is opposite 696 region on the Square of 9 wheel. Yesterday’s all-time “breakout” high on the SPX.
Price is Time, Time is Price potentially playing out before our eyes.
So we have a synergistic relationship between the 1929 top, the 1973 top and the 2000 top and
Theoretically a 2026 top this week. It remains to be seen.
Obviously all record tops are all-time highs. If we gotta have one there is a lot of synergy that makes Friday a good fit.
Shall we call it a “Square of Rain” in tribute to The Grateful Dead?
By time 2026 and 2027 are over, there may be more than a few bulls who may wish they were “grateful dead.”
The weekly SPX above shows last weeks Rule of 4 Breakout.
A reversal back “below the line” at 6896 is a yellow flag.
It suggests that the breakout hit its head on a 3 point Tops Line/
In turn a drop below 6885 ish breaks the Bottoms Line from November 21, triggering a Rule of 4 Sell signal…AND a Triangle Pendulum Sell.
Taken together these two signals confirm a false breakout.
Further confirmation will come on breakage of the last important swing low…the December 17, swing low of 6720.95. Trade by even 1 cent below 6720.05 triggers the December Sell Indicator.
This indicator is triggered when the December low is broken in January.
It’s history suggests a down year.
In sum, despite Friday’s run to a record high in the SPX, my expectation is the market appears to forming an important short-term top—likely early this week, before entering a meaningful decline.
Whatever the market does today and Tuesday—a sharper decline should begin on Wednesday.
The market may attempt to float higher after a 10:45 low according to the Roadmap.
A high is indicated at 11:15 through 11:45 with a small pullback into 12:15.
From there a rally that tests session highs from the 11:15 time-frame at 12:45.
This is where we want to be on high alert as a sharp, persistent drop into 2:00.
It is followed by a sharp retrace into the close.
If the Roadmap proves to be a savvy as it was with Friday’s forecast, then the last half of today’s session memorializes a volatility that will persist for weeks, perhaps months.
Natural cycles are transitioning beginning in this time frame and going into late January.
Remember, additionally we are 270 degrees from the April 7, 2025 low.
As these shifts occur, different sectors may weaken one after another, creating a broad-based decline.
I am not expecting a Flash Crash; that would play into the hands of the vast majority of traders.
The bears are expecting a crash. The bulls are expecting a flush-out.
Mr. Markets job numero uno is to deceive and thereby hurt the most people.
Friday’s monthly option expiration could be doozy as based on my analysis Friday has the potential to be a meaningful down day.
That said, there is an Inversion Pivot slated for Friday which means if the prediction inverts the market could stage a sharp rally.
Friday could be a good date for ODTE’s.
For the downtrend, while I do not see a crash per se (at least not at this point), intraday swings may be sharp. For example a 2% sell-off could be followed by a 1% bounce the next day. Traders holding overnight call or put options could face significant losses due to whipsaws. It is going to be a tricky environment—especially for those relying on emotions rather than discipline. This market phase is designed to test emotions and discipline where as the last 9 months was Buy The Dip on steroids…going with emotions over discipline paid dividends.
I expect an overall correction in the SPX to be around 7 to 12% from current levels unfolding gradually the next 4 to 6 weeks.
Averaging out at 10%, that takes the SPX to a test of the 200 dma now at 6323.
A deeper decline is possible, but either way, I expect a rally to play out after the sell-off putting in a Secondary High.
Tomorrow’s report will showcase when to look for cycles to turn in 2026.