“No stop signs, speed limit
Nobody’s gonna slow me down
Like a Wheel gonna spin it” Highway To Hell, AC/DC
As geopolitical tensions mount to levels not seen since October 1962 with the Cuban Missile Crisis, complacency in markets is so thick you can cut it with a knife.
Since mid-May we have a 5th Hindenburg Omen potential crash signals on the clock.
We also have a Titanic Syndrome signal flashed in May and June.
Both of these are breadth indicators used to identify periods when there is weakness below the markets surface that points to downside risk.
The Hindenburg Omen for example has appeared before every major market crash or panic over the last 39 years.
The key word is “before”. How soon before? That’s what we all want to know.
In markets, timing is everything especially if you seek to capitalize on a potential outsized move with options.
To wit, on June 14th, 2024 as the SPY closed at a record high, the McClellan Oscillator (a breadth indicator) closed -49.86…an record low for any day the SPY struck a record high.
Think about that—a record of negative breadth that supersedes the REGION of any prior peak in the last 100 years.
That was two weeks ago. The market has continued higher…albeit not all that much, but higher.
The point is indicators are warning signals. They are not necessarily meant to coincide on the day of The Top.
Negative divergences in new highs and new lows and breadth indicators can remain negative for some time at tops.
Markets can remain overbought for a long time before succumbing to gravity or whatever force you like to make the call the catalyst of the culprit for a reckoning.
Why?
This is because Mr. Markets job number one is to deceive.
This is why I don’t use indicators per se. I look at them but they are background.
Why?
All indicators are derived from Time, Price and or Volume.
Therefore they are of second degree magnitude.
In my experience indicators are more descriptive than predictive.
I believe in going right to the horse’s mouth: Time & Price.
Above I said the key is not to tell me THAT Hindenburg Omen’s are on the clock but tell me WHEN it matters.
WHEN IT MATTERS.
3 simple words that make a ton of difference in trading.
As the saying goes, the market can remain irrational much longer than we can remain solvent.
When it comes to WHEN…Time and Price are the final arbiter.
W D Gann wrote that when time and price square-out (balance out or align) expect a change in trend.
He also offered that all prior major tops and bottoms have a relationship with some other prior market tops and bottoms.
In other words, they are tops and bottoms have an harmonic relationship with each other.
In keeping with W D Gann’s Law Of Vibration…tops and bottoms vibrate off each other.
Allow me to give an example.
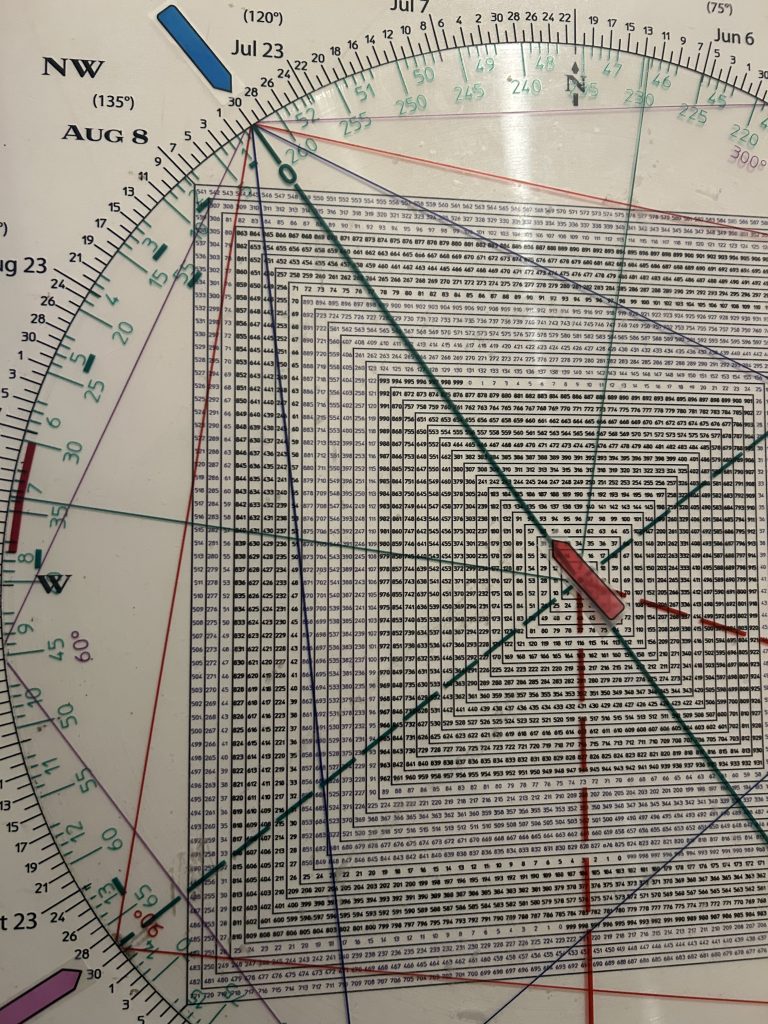
Last Thursday the SPX struck an all-time high of 5505 (550 to use with my Time & Price Calculator pictured below)

Square of 9 Wheel
Purchase your own Square of 9 Wheel. Shipping to US only. Contact Jeff for shipping outside the US.
As you can see in the image below 550 (blue) squares out with 482 (yellow).
Why that’s potentially important is that the major January 4, 2022 high was 4818.
Rounding gives 482.
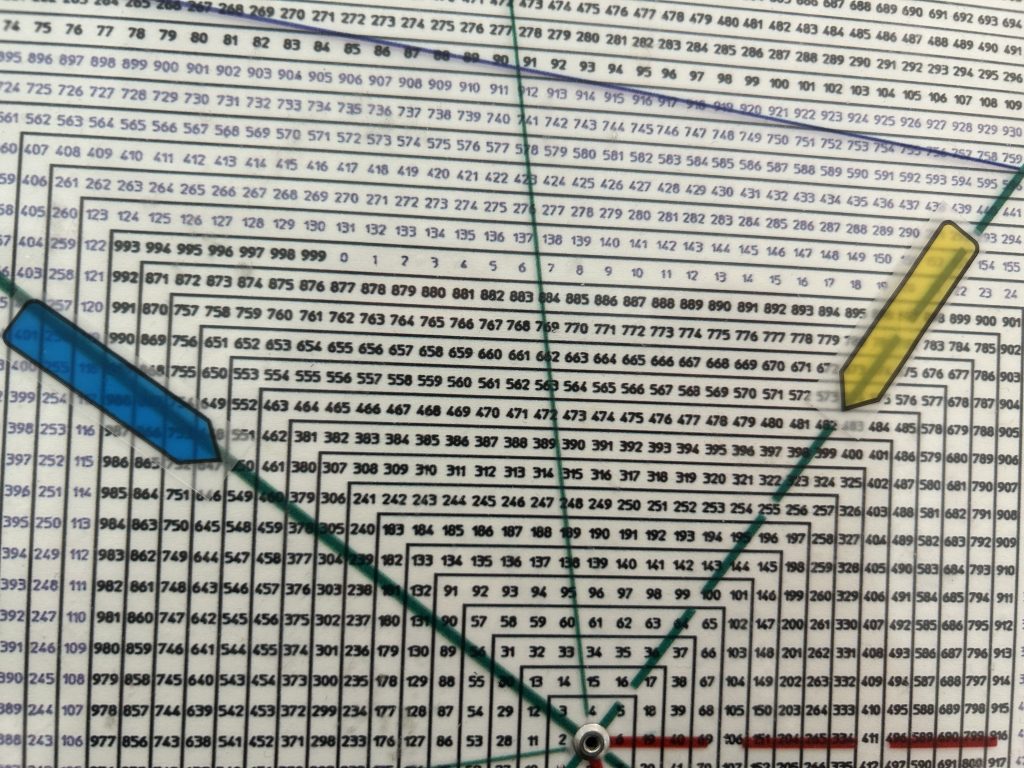
In my experience, the odds of a turning point are enhanced when there are a cluster of time and price synergies.
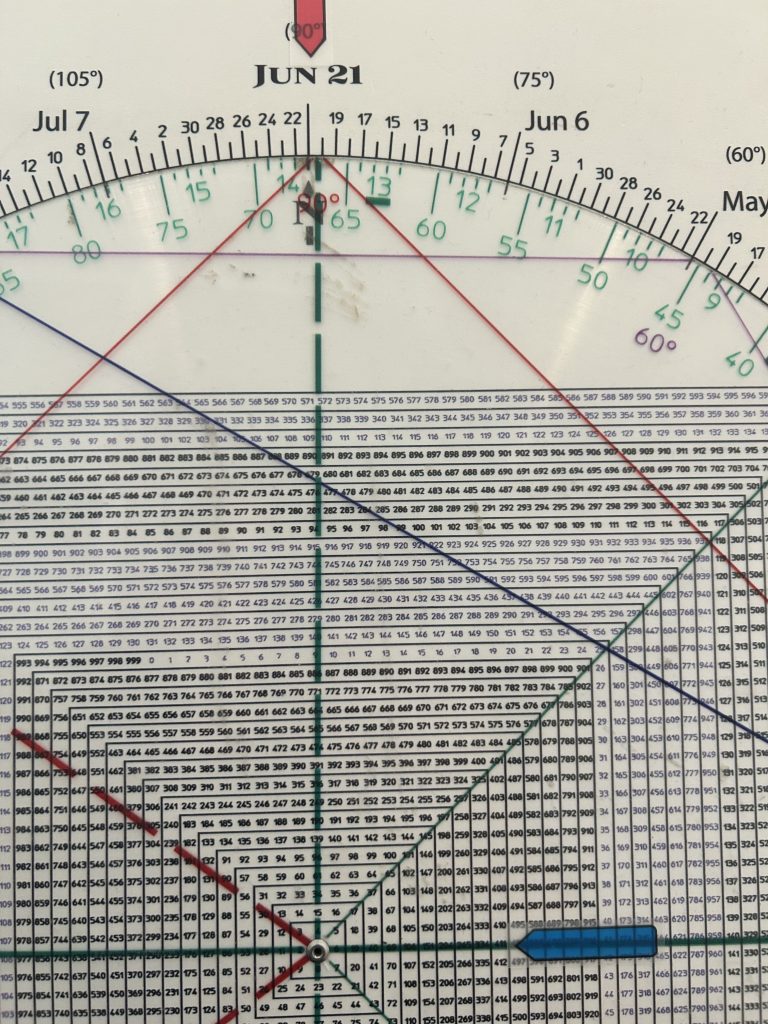
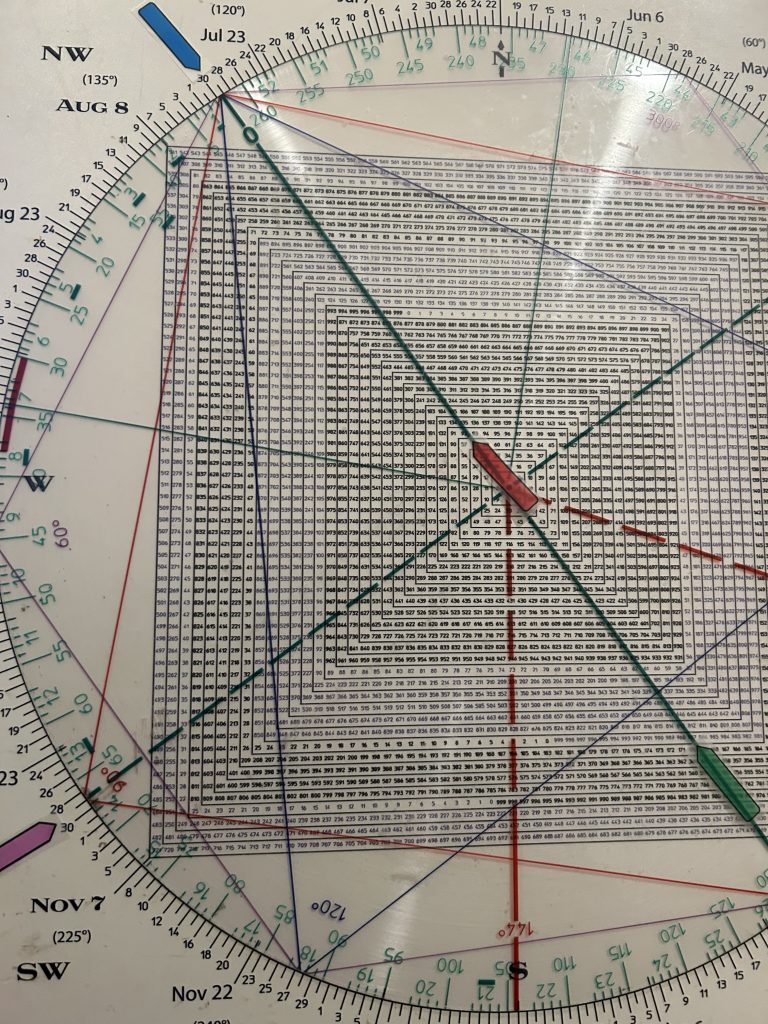
The following Sq of 9 shows that the 4104 October 2023 low (blue) squares out with June 20th (red), the day the SPX produced a third Key Reversal Day in 3 months.
Is the third time a charm for the bears?
In sum, on Monday, the SPX turned its 3 Day Chart down. This occurs with 3 consecutive lower daily lows.
The last time it occurred was on May 31st.
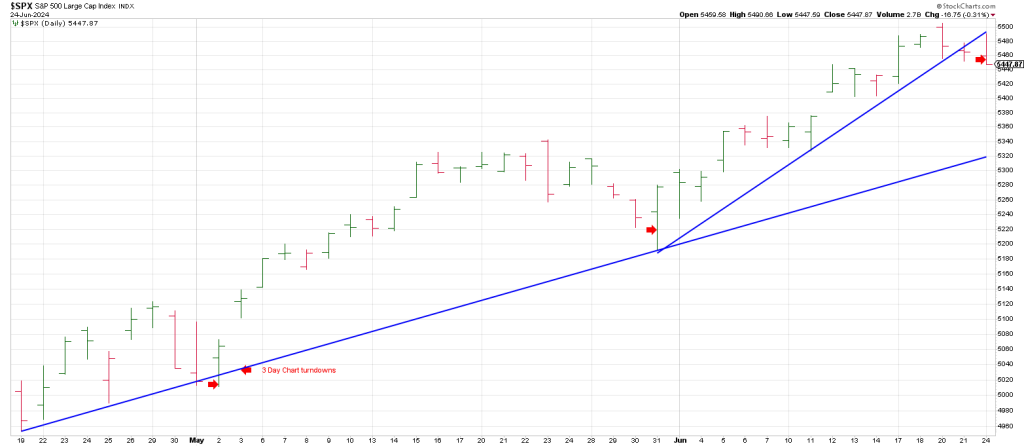
In a strongly trending market a turn down in the 3 Day Chart will typically define a low soon in terms of time and price…if not immediately.
That was the case on May 31st when the SPX reversed to the topside leaving a large range outside up day after testing/undercutting its 20 day moving average for the first time since recapturing it after the April 19th low.
The market exploded.
The behavior over coming hours/days following Monday’s turn down in the 3 Day Chart will be telling.
Downside follow thru opens the door to 5420 and 5380.
Drilling down to the hourlies shows a mid channel line at the 5420 region.
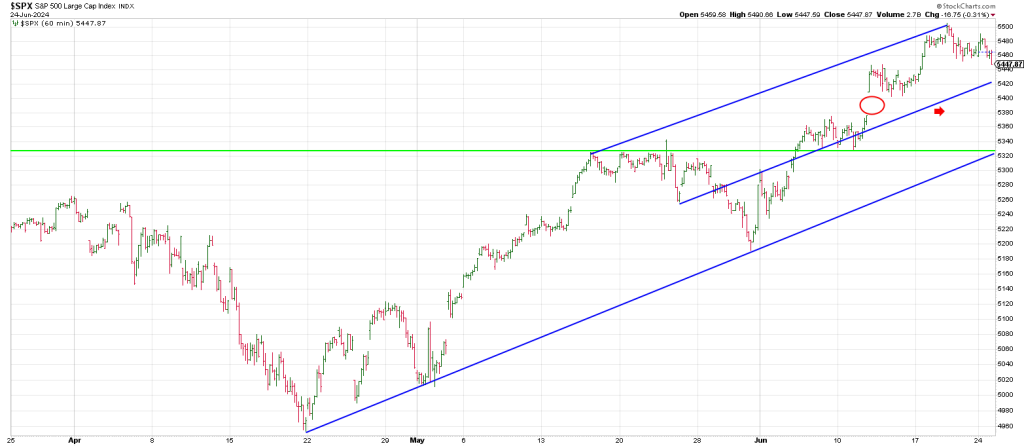
5380 fills the open gap from June 12th.
A Jump The Creek sell signal would be triggered below Phil D Gap at 5380 opening the door to a larger decline to 5320.
5320 is an hourly Bottoms Line from the April low.
This is a critical level as it also ties to horizontal support (green).
Horizontal support is the May tops. Note how the June breakout over May highs “checked back” to find support before the Breakaway Gap on June 12.
Prior resistance becomes new support—unless there is a trend change on the table.
Consequently this region from 5380 down to 5320 is key to the near term.
As offered yesterday on the Hit and Run Private Twitter Feed when the index was flat, my expectation is for a reaction of as much as 100 SPX points.
Downside follow through after Monday’s turn down in the 3 Day Chart opens the down door.
For the moment, if we get the reaction I am looking for and the 5320 region holds, my expectation is Death Rattle Rally into July.
We will walk thru the significance of July in tomorrow’s report.
Suffice to say that July 8th is the anniversary of the 1932 low after the 1929 crash.
W. D. Gann stressed the importance of anniversary dates (+ or -).
“In my research work I have discovered that stocks make an important change in trend in the months when they reach extreme high and low. These are what I call anniversary dates, and these important dates should be watched each year for important changes in trend.” W D Gann.
Interestingly, July 8th “points to” 95,
1932 is 92 years ago. On the Square of 9 Wheel, 92 aligns with late July. IT ALSO SQUARES OUT WITH OCTOBER 29, THE CRASH DAY IN 1929.
The synergy suggests there is a crash on the clock this year.
Allow me to give you another example of time/price crash synchronicity.
1987, the year, squares out with October 29th.
It suggested a crash would occur in October 1987.
The top before the 1932 low was 95 years ago in 1929.
95 vectors/vibrates off July 4th/July 8th.
Notice how they all tie to 1987 (blue
July looks historic.