Tuesday continued the pattern of internal weakness accompanied by rising headline prices in the indices: net advances on the NYSE opened negative—even as the DJIA was up 200 points—and stayed negative for the entire session. By the close, the DJIA finished +185, SPX +16 and NAZ +137, yet NYSE net advances were -276 and NAZ net advances were -145, despite both exchanges opening sharply higher.
These readings deliver a straightforward but often overlooked message: although a handful of mega-cap names continue to push the indices higher, the majority of stocks on the NYSE and NAZ have been under distribution for several months—and continued to be on Tuesday.
This is reflected by new 52 week lows rising sharply over the same period.
While all major averages were higher on Tuesday, breadth at the close underscored the deeper message: the rally remains increasingly narrow, driven by a shrinking group of leaders.
For example:
LITE left an LROD to the downside.
SNDK also carved out an LROD in the context of its continuing stretch below its 20 DMA
STX also traced out a large range outside down day. Ditto its cousin, WDC.
AMD rolled over after trying to reclaim its 50 DMA. Bearishly this follows a turnup in its 3 Day Chart on Monday. With Tuesday’s reversal, AMD looks like a hazardous Droop Right Shoulder.
COHR blasted higher in the early going but reversed leaving a Soup Nazi sell signal. Downside follow through opens door to 155 region.
On the bullish side, MDB sky-rocketed.
TER ripped to a new closing high.
MRVL exploded after reporting.
INTC continued its comeback making a new 18 month high.
How can the market persist to hold up/rally in the face of internal weakness?
Because the technicals tell the CONDITION of the market, where it has been.
Cycles, on the other hand can enlighten us as to where it’s going.
As WD Gann stated, “Time is more important than price.”
When Time and Price “meet” or balance out we can expect a change in trend.
Below is a monthly SPX from the 666 March 2009 bear market low.
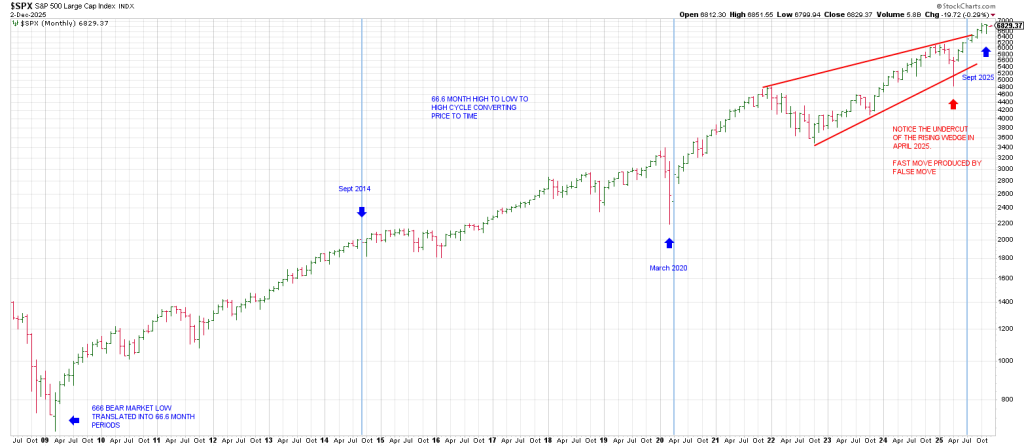
Moving the decimal point we get 66.6.
Converting Price to Time and counting 66.6 months from March 2009 gives September 2014.
As you can see that basically put a lid on the market perpetuating a correction into Feb 2016.
18 months later.
Another 66 months later is March 2020. The Covid Crash low.
Interesting.
Moving forward another 66 months gives Sept 2025.
We have an all-time high in Oct.
However, remember we are using 66 months versus 66.6 months.
Using 66.6 months is a direct hit with October 2025.
In sum counting from the low….a possible High to Low to High Cycle may be on the table:
2014, 2020, 2025.