“Big movements take time to develop.” Jesse Livermore
“The money lost by speculation along is small compared with the gigantic sums lost by so-called
Investors who have let their investments ride.” Jesse Livermore
“I’m up on the tightwire
One side’s ice and
One is fire.” Tight Rope, Leon Russell
On Friday, January 24, the SPX gapped up to strike a record high just above its December 6th prior all-time high. It reversed to close near session lows.
The following Monday, January 27th, stocks had a massive gap down, battered by DeepSeek’s debut.
On Friday January 31, after filling the gap from January 27, the SPX also saw another even sharper reversal.
Once again the following Monday, Feb 3, saw another massive gap down.
In both instances Hit and Run members cashed in on puts.
Last Friday, once again, the SPX rallied on the open and once again reversed leaving a Lightning Rod (Large Range Outside Down Day/LROD)
Will today be another Manic Monday?
Is it too pat?
As I write this Sunday night the futes are up 15 points.
Is the green a head fake?
If the market pops up, 3 on a match comes to mind.
This refers to where a 3rd solider pokes his head to get a cigarette lit from the same match and gets shot.
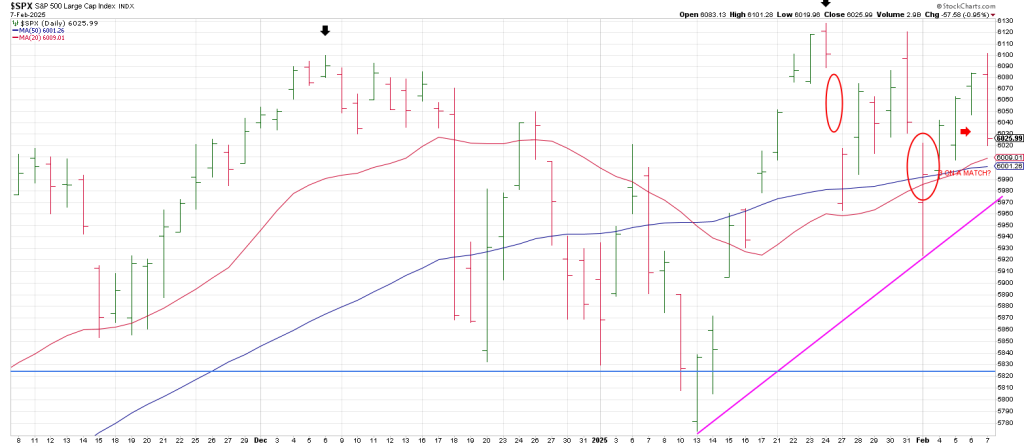
The downside pivot for the SPX is a Bowtie of its 20/50 day moving averages at 6000-6010.
Breakage below 6000 opens the door to 5972. This is 180 degrees down from the all-time high.
Importantly, 5972 ties to a rising trend line connecting the January 13 low and the Feb 3rd low.
Breakage below this region opens the door to a full 360 degree drop to 5818.
This represents a test of the January closing low.
The upside pivot is 6050. This is 90 degrees down from high.
The index backetested 6050 late Friday and faltered into the bell.
This is an important week technically based on the weekly position of the SPX.
The index is in the weekly Plus One/Minus Two buy position on a test of its 20 week moving average.
The weekly Plus One/Minus Two is a key element of the Hit and Run Methodology that does a good job of identifying the near term trend.
A Plus One means the 3 Week Chart is up.
The Minus Two part of the setup occurs anytime there are two consecutive lower weekly lows while the 3 Week Chart is pointing up.
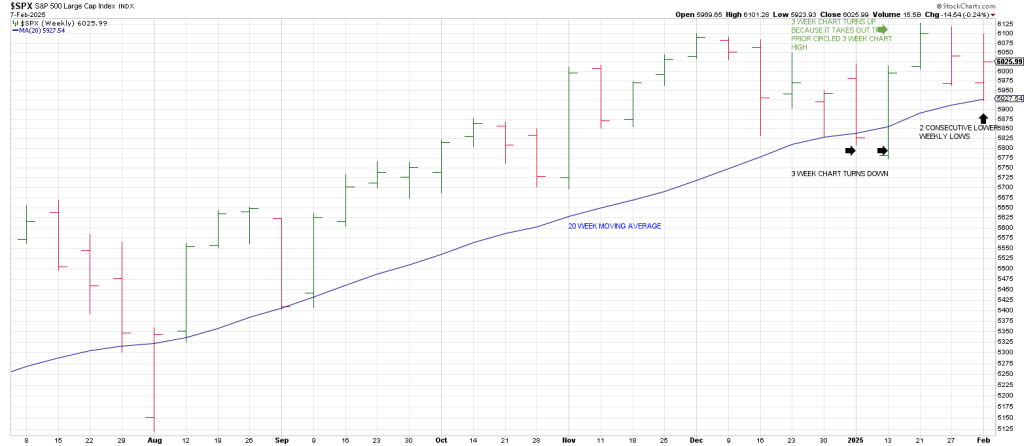
The T Rex in the ointment may be that the SPX recently tested its 20 week moving average in mid-January.
So we’ve been there, done that.
Another test may fail in the spirit of the second mouse gets the cheese (in this case the bear cheese).
Using 2009 as “zero” we are in the 15th year of a Super Cycle advance.
15 years is an important time period.
It is 90 degrees of W.D. Gann’s Master 60 Year Time Cycle.
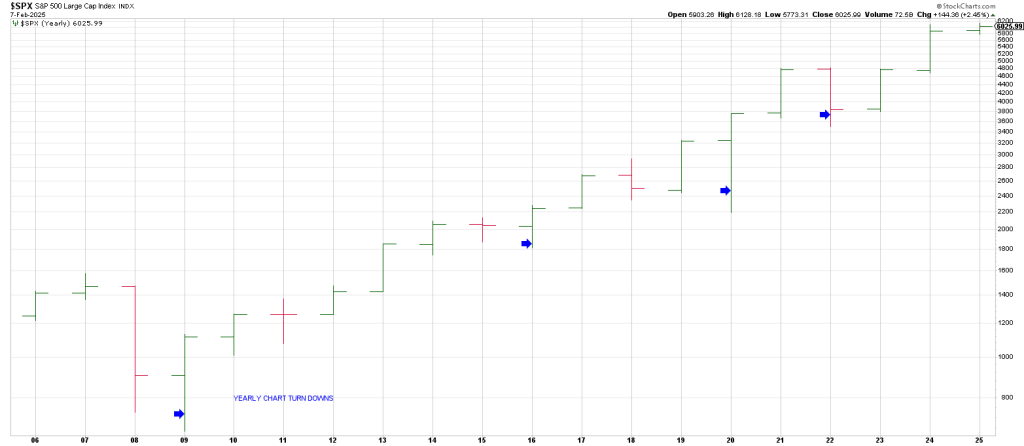
The blue arrows represent each time the yearlies have turned down since 2008.
Each one defined a low.
The SPX is up 9 fold over that period much more than its ever been in any bull cycle.
The cycle is 3 times as long as any other bull cycle.
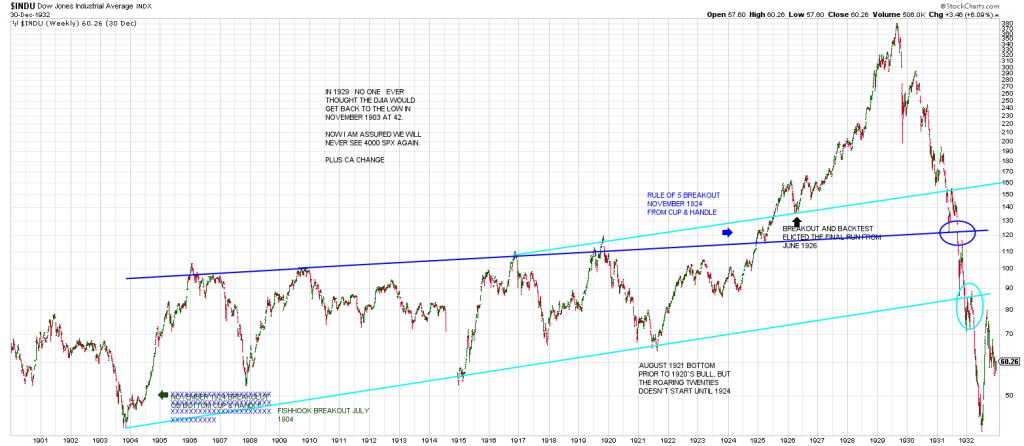
The 1920’s bull market started at 63.90 in August 1921 and ended almost exactly 8 years later at 386.
A 6 fold move.
While the low was in 1921, what is known as the Roaring Twenties in markets was the 5 year advance from 1924 to 1929.
Below is a chart from our report in November, Star Burst Pattern.
By contrast China is about a double from where it was in 2009.
The euro blue chip index is up about a double and a half.
The Nikkei has gone up 6 plus fold in this period.
However when you look at the U.S. lead index, the NDX, it is up around 18 fold since the 2009 low.
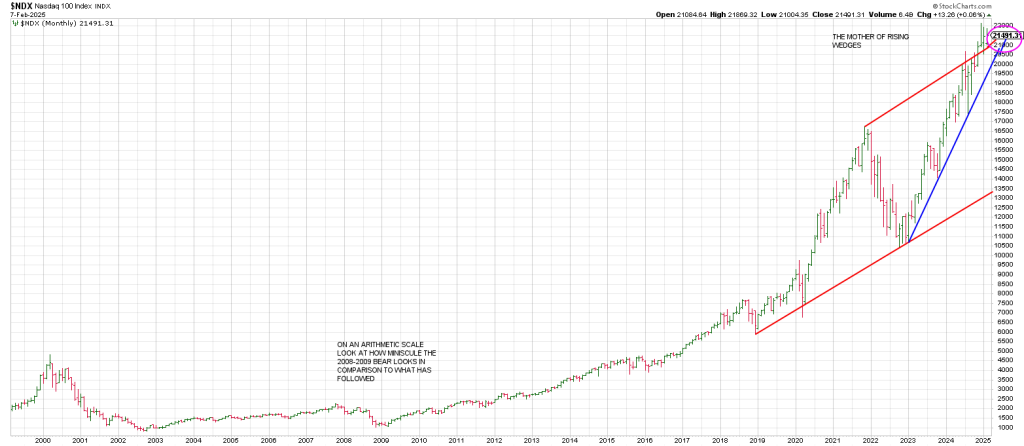
That’s an arithmetic scale to give you some idea of where we are.
The Great Financial Crisis looks like a non-event.
It looks like the Mother of All Rising Wedges is on the table.
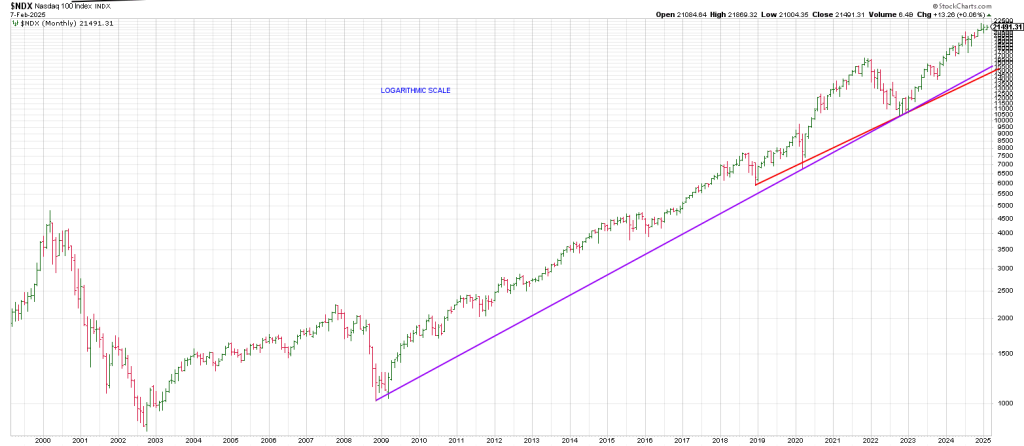
Below is a monthly logarithmic NDX
Drilling down to a monthly NDX starting from the 2021 top shows it exploded after turning its 3 Month Chart down in October 2023.
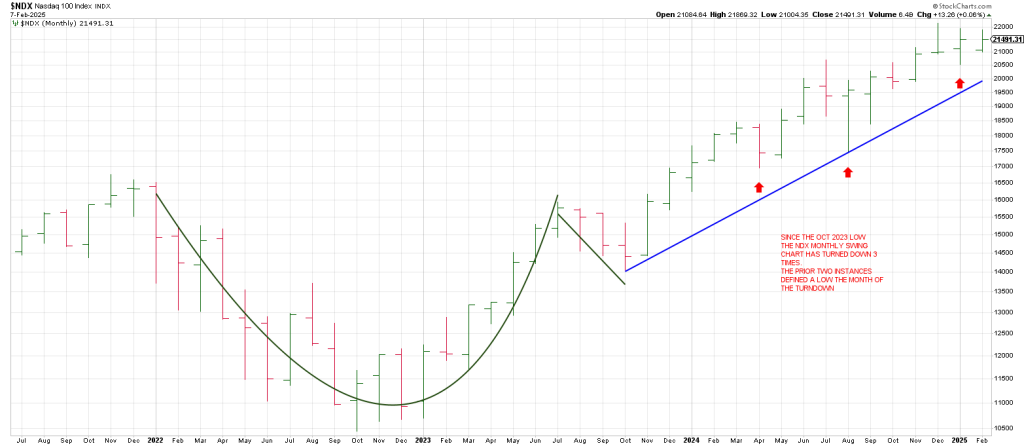
Since then each turn down of the Monthly Swing Chart has defined a low.
The NDX has never punctured a prior monthly turn down low since October 2023.
It turned its Monthly Swing Chart down in January.
Trade below the January low will be a conspicuous change in character—especially if it perpetuates downside follow thru.
December left a signal reversal bar, a monthly Topping Tail.
A yearly NDX (logarithmic) shows the Yearly Swing Chart turned down only once since it last turned down in 2008. That was in 2022.
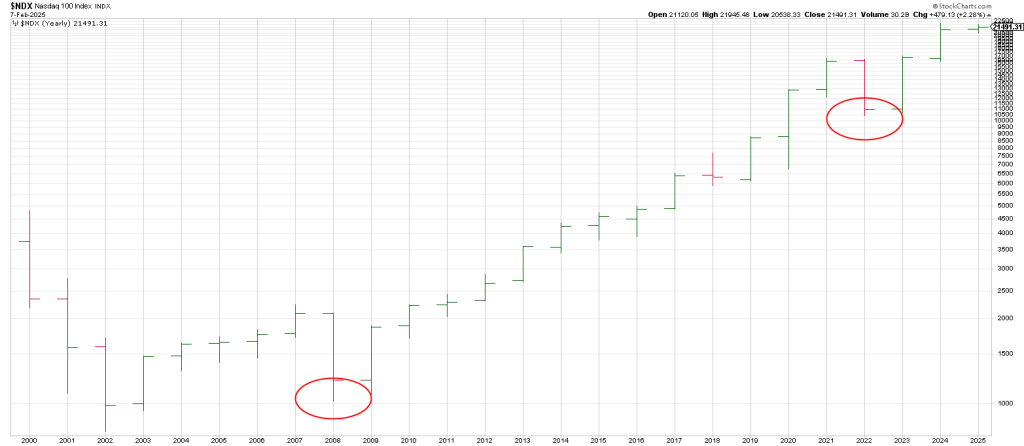
Since then the NDX is up well over 100%.
I know. It’s the AI New Paradigm.
That was the narrative regarding the Internet New Paradigm in 1999/2000. It was correct.
It didn’t stop those stocks from getting slaughtered.
It was the narrative in the auto, aviation and radio industries in the late 1920’s.
RCA was the AAPL of its day. The stock increased 200 fold.
It collapsed after the 1929 peak dropping from 114.75 in September 1929 to 2.62 in May 1932.
GE acquired RCA in 1986 and dismantled it, selling off most of its parts.
When will the bubble burst?
You can’t look at economic indicators to tell you when the market downturn is going to start.
The market IS the leading indicator in super-cycle bulls.
There is not a lot out there that is making people happy what with inflation.
You yank the market down with a ‘normal’ 10% correction , you’re going to drum up a lot of doubt and that’s when emotion will ripple through the economy…as to what is being spent and who is being laid off.
When a bubble breaks, reality breaks in.
My time-tested adage is that the news breaks with the cycles, not the other way around is magnified even more so when super cycles reverse.
The stock market will be THE indicator, not the other way around.
In sum, it’s stunning that the large cap indexes are still near all time highs in light of the bearish earnings reaction to all of the Magnificent 7. Only META advanced.
AMZN, GOOG, TSLA, AAPL, MSFT sold off.
NVDA has yet to report but it got hit due to DeepSeek.
Up until a few months ago, the narrative was that the market was only being propped by a handful of big tech stocks with everything else under a cloud.
Now the tables have turned.
As soon as you think you have the key to the market, somebody changes the lock.
“Everyone” is overweight in big tech, which is now under-performing.
The big winners now are other names—
PLTR, NET, RDDT, CAVA, AFRM, SHOP, CRDO, etc.
That said there is no such thing as a safe stock in a bear market.
It doesn’t matter how great their prospects or fundamentals are.
When they raid the house, they take the piano player too.
The stocks of the best companies on the planet will correct 50% in a bear market —and that’s not ever a Super Cycle Bust which I think is looming.
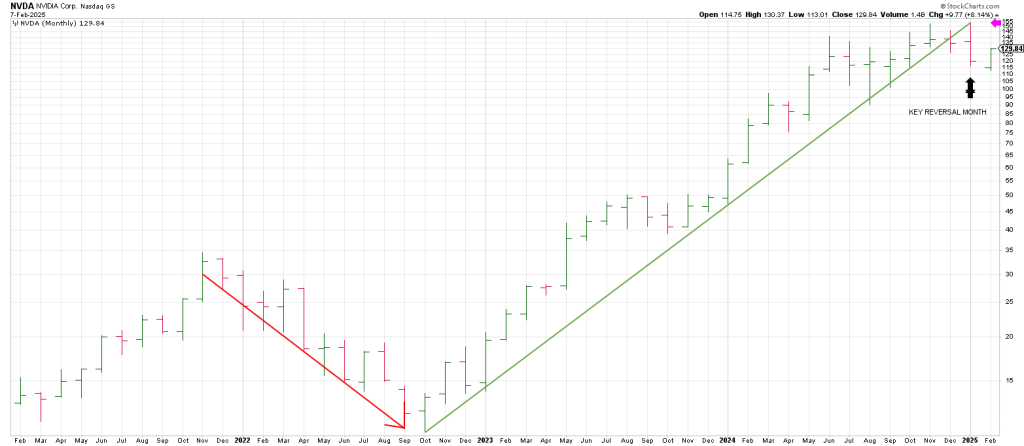
In 2022 NVDA, for example, fell from 340 to 108 (pre-split), in 10 months.
The market hasn’t seen a real bust since 1929.
A Super Cycle bust must be measure in Time as well as Price.
The GFC lasted 17 months.
The low following the ’29 bust was 93 years ago in 1932.
On the Square of 9 Wheel, 93 points to January 23rd.
January 23 is the closing high for the SPX. So far.
The more time that passes without making a new high and or a break our below key downside pivot is the sign of the bear—one side’s ice, one sides fire.
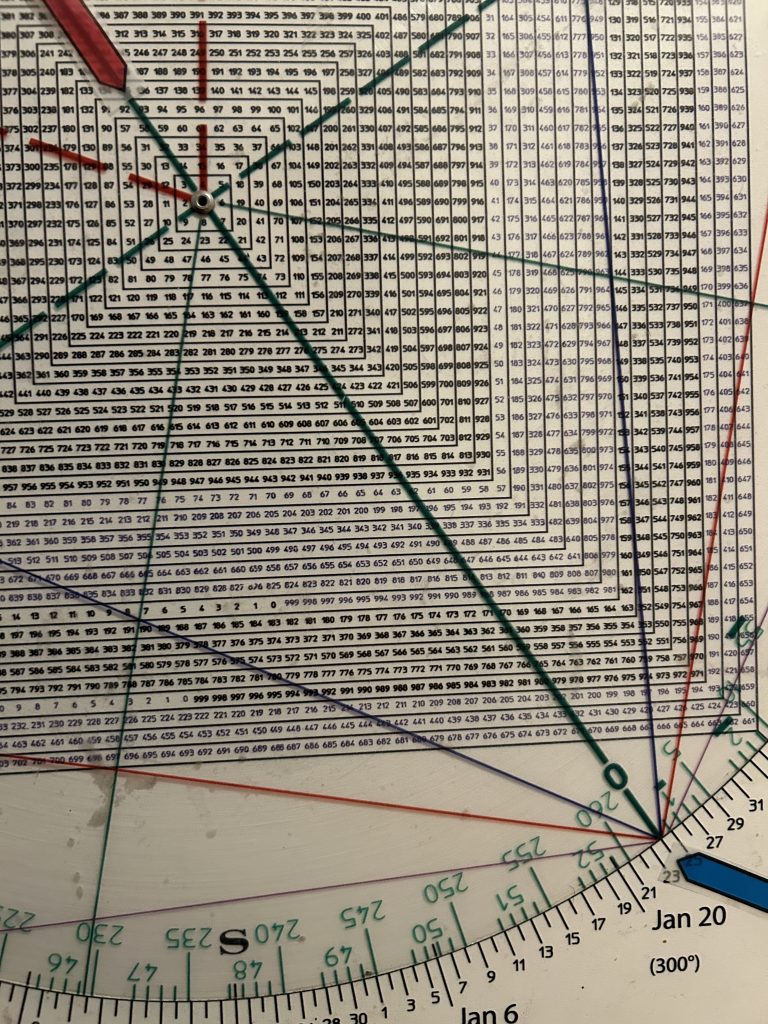

Square of 9 Wheel
Purchase your own Square of 9 Wheel. Shipping to US only. Contact Jeff for shipping outside the US.