Over the years, Jeff has accurately predicted major market ebbs and flows. He’s been spot-on with everything from the crash of March 2020, to the meteoric rise in precious metals prices in 2024.
← Back to Powerful Market Insights“I see a bad moon a-risin’
I see trouble on the way.”
–Creedence Clearwater Revival
“As a human being, one has been endowed with just enough intelligence to be able to see clearly how utterly inadequate that intelligence is when confronted with what exists.”
-Albert Einstein
“Any fool can believe the truth, it takes a genius to believe a palpable lie.”
-Anon
The intersection of technology and culture has produced a societal quickening.
Alvin Toffler’s radical 1970 book, Future Shock, theorized that things were changing so fast we would soon lose the ability to cope
Well the future is now and most of us are finding hard to adapt to The Quickening, the digital metamorphosis of the present.
This is particularly apparent in financial markets where it is hard to tell what’s driving markets,
Humans or machines.
One day the market is trending higher and gets hit in the last hour for no apparent reason.
The next day the market is flat until the last hour and explodes out of the blue.
Does big money all of a sudden to pull the trigger en masse in the last hour when it has had all day to buy and sell?
We were told the decimalization of the markets was to make things fairer for the retail trader but in truth it was to enable High Frequency Trading. The domain of the Algomatics.
Wall Street traders no longer invest in a future…which is what capitalism was supposed to be about.
They expect immediate profits off their algorithmic trades in an ultra fast momentism.
The tape has become entirely transactional, amplifying market concepts such as Soros Theory of Reflexivity as well as technical and fundamental methodologies.
I learned the markets from my Dad who ran his private hedge fund.
He was the best tape reader I’ve ever met. He didn’t know anything about charts.
Reading the tape used to be like watching the wings of an eagle.
Now it’s like trying to decipher the wings of a hummingbird.
It can’t be done.
Despite a tape that whipsaws from program to program and often feels like a vortex of seeming randomness and presentism, over a 40 year trading career I have thoroughly satisfied myself that the market is mathematical and deterministic.
As legendary market seer W.D. Gann stated, “Everything is existence is based on exact proportion and perfect relationship. There is no chance in nature, because mathematical principles of the highest order like at the foundation of all things. Faraday said “there is nothing in the universe but mathematical points of force.”
To understand this we must look at time periods and cycles and understand as well that price also moves in cycles.
At this point you night be thinking “What does this have to do with the S & P 500 right now?”
In a nutshell, the market is broken at a time when a quickening is threatening and cycles from 1987 and 1929 are due to exert their downside influence.
It is 58 years from 1929 to 1987. It is 95 years from 1929 to 2024.
There is a Fibonacci 1.6 relationship between 95 and 58.
It is 37 years from 1987 to 2024.
37 divided by 95 is Fibonacci 0.38.
On the Square of 9 Wheel the number 37 points to May 7th.
Gann wrote “When time and price square-out expect a change in trend.”
My Square of 9 Wheel integrates time and price.
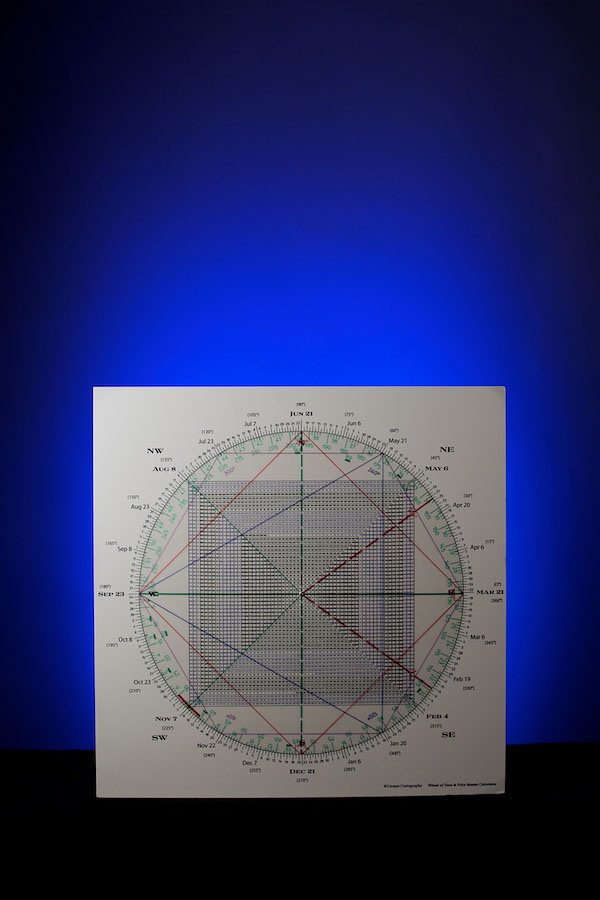
Let’s take a look at the SPX/SPY.
The SPY bottomed on October 27th, 2023 at 409.
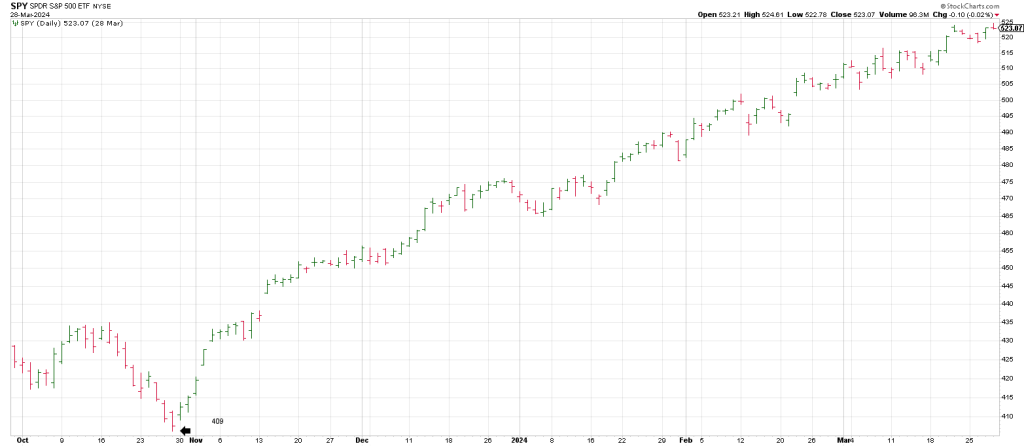
409 is opposition today, April 1, for a possible time/price square-out.
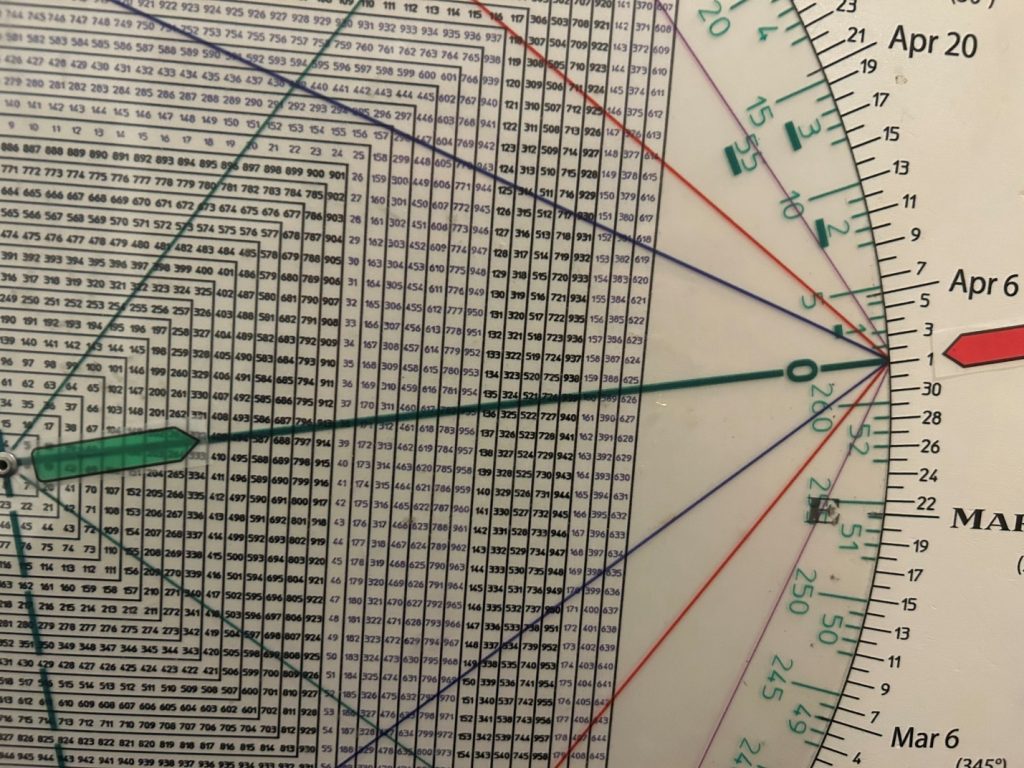
The SPX itself bottomed at 4104 (410) which squares out with March 28th.
The price of the low points to today.
If it’s valid, it’s always the WEEK OF.
This week may be a top defined by a time/price square-out
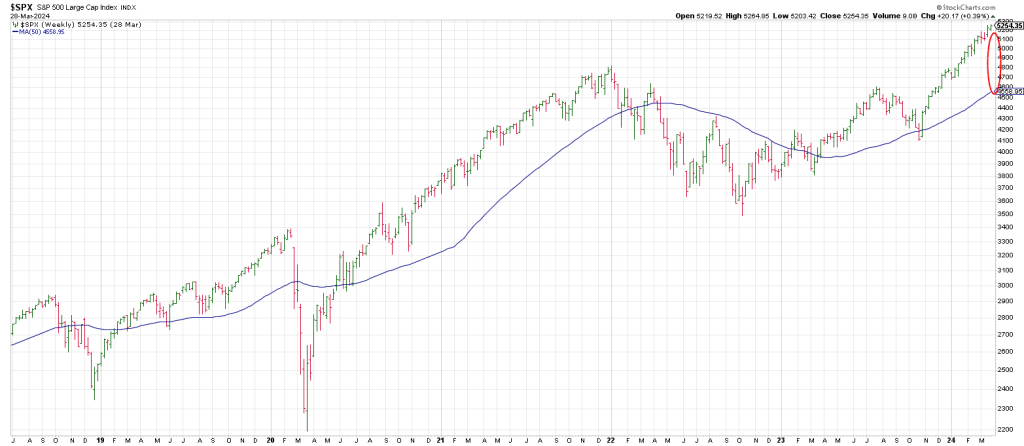
What could possibly go wrong when the SPX is this extended from its 50 week moving average (200 day moving average).
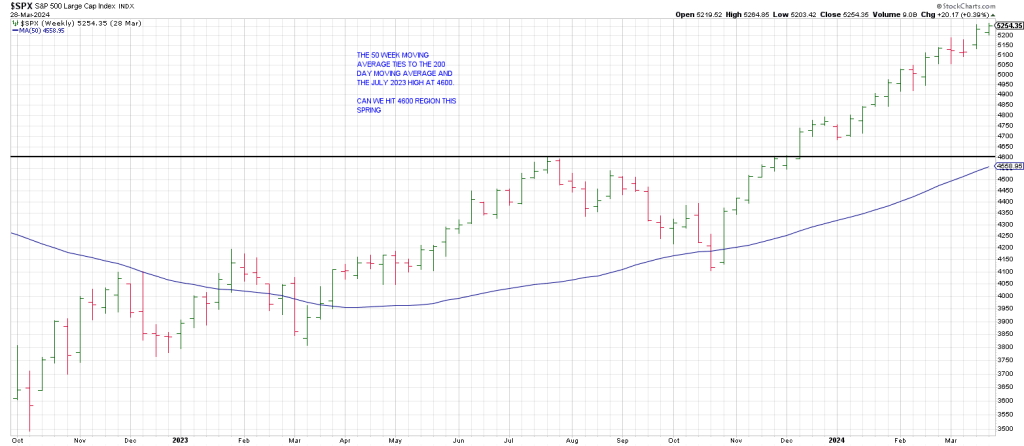
It’s more extended from the 50 week moving average than it was just before the Feb 2018 crash and the Feb/March 2020 crash or in July 2023.
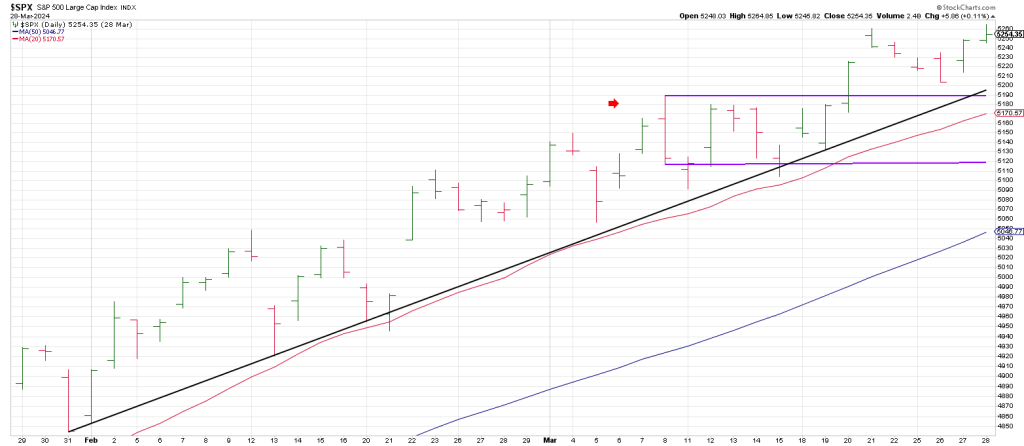
Checking a daily SPX shows it scored a Key Reversal Day on March 8th.
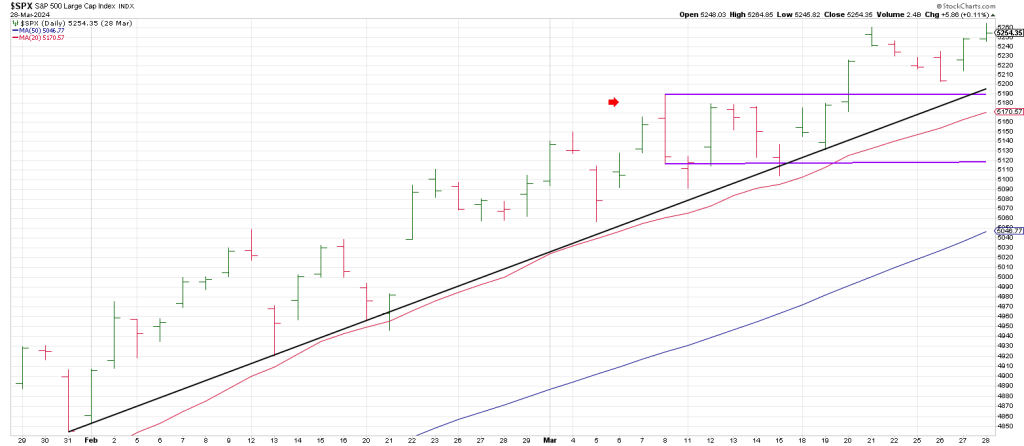
While obviously the SPX has extended above the March 8 high there are two factors that leave it suspect:
1) The SPX has only cleared the March 8 high for the last week or so and not with fireworks. It has grinded higher. We have not seen a run for the roses consistent with the Buying Climaxes seen for example at the March 2000 top or the January 2018 top.
2) As well, many “generals” have not made new highs and are not even close to doing so. In fact they look like they are under distribution.
Names include MEATA and CRM and the overall Semiconductors, SMH.
Let’s look at all three.
META triggered a Rule of 4 Sell signal on Thursday breaking below a 3 point trend line.
It left bearish Train Tracks on March 7/8.
CRM also triggered a Rule of 4 Sell signal on Thursday.
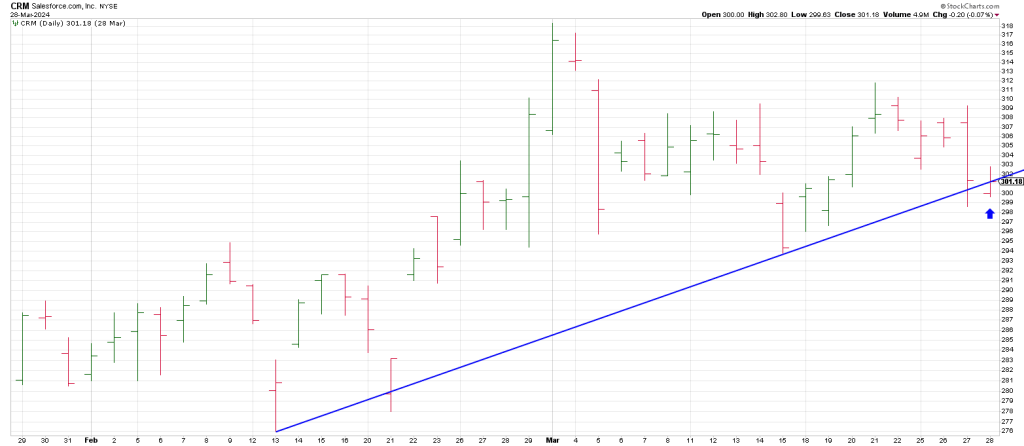
CRM hasn’t made a new high since March 1st.
So both these generals broke rising short term trend lines on a day when the SPX closed at a record high. This is not a good omen if we see downside follow through in April.
SMH left a large range Key Reversal Day on March 8.
It tested the low of the high bar close day, March 7th, on a gap up on March 21s but was unable to get upside traction and is treading water.
A close below its rising 20 day moving average is a conspicuous negative at this stage.
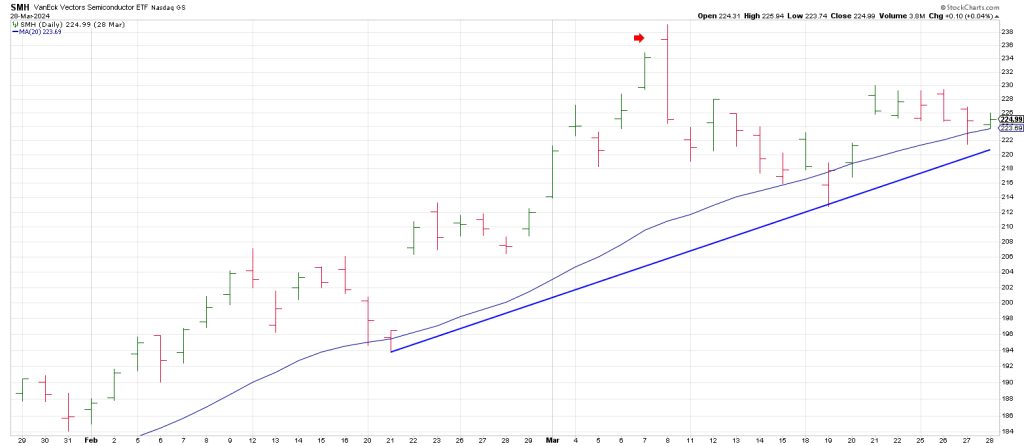
The takeaway is that March 8th may be the internal, orthodox high of this rally even if we do see some upside momentum this week.
A reversal back below the March 8 high of 5189 is a warning sign.
A reversal back below the March 8th low of 51.17 is a blaring siren.
Remember just because the SPX is higher than it was on March 8th, B Waves can exceed the prior swing high. This is what occurred in February 2020 when the SPX rallied somewhat above the January high that year prior to a C Wave crash.
In addition the advance from the October 2002 bear market low into the October 2007 bull market high was a B Wave with a marginal new high over the March 2000 prior top.
My take is the subsequent advance since Oct 2022 into April 2024 is a B Wave. My expectation is that a C Wave Crash will play out this year…with a strong likelihood this quarter.
Hit and Run members will be alerted when to pull the trigger to capitalize on the downside—just as they have been positioned in GLD calls and AEM calls and UGL in addition to several precious miners before this months blast off.
Let’s see what IWM, the Truth Teller, has to say about a downdraft.
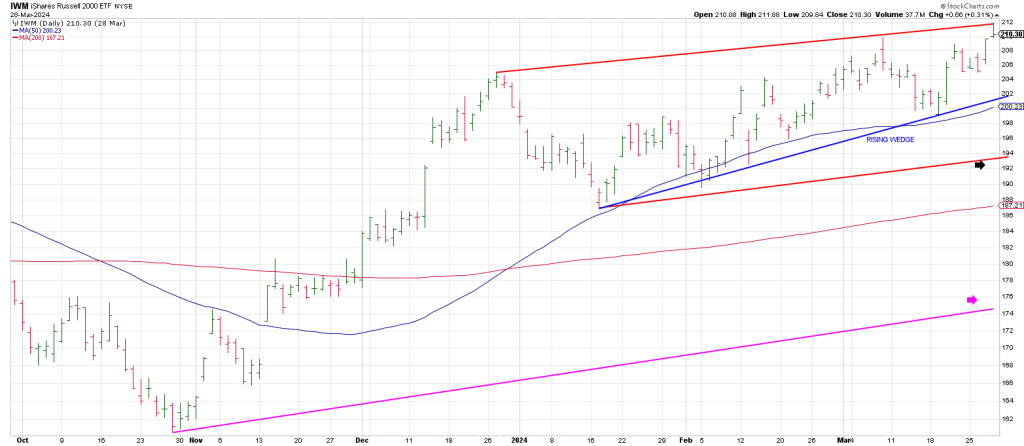
The hope of the bulls has been that the market is broadening out mirrored by recent strength in IWM.
However, IWM reversed after hitting a 3 point trend line on Thursday.
It may have carved out a Test Of A Test Pattern failure.
Specifically, IWM tested its December high on MARCH 8 and reversed leaving a Gilligan sell signal (a gap up to a new 60 day high with a close at/near session lows).
Then it tested the March 8 high last Thursday and tailed off leaving a Lizard sell signal, a 10 day Topping Tail.
I paralleled a line off the Tops Line from the January 17th low. It ties to the 194 region.
There is a rising 3 point trend line from the January 17th low that forms a Rising Wedge. This trend line currently ties to the 202 region and the 50 day moving average.
Since reversals/drops out of Rising Wedges can be sharp and fast, it would not surprise me if downside follow thru saw the IWM 50 day hit in April with breakage below that opening the door to the 200 day moving average at 188.
There is a time/price square-out on the table on IWM.
Thursday’s high of 212 ish (213 to be exact) squares out with the October 27th time of the low.
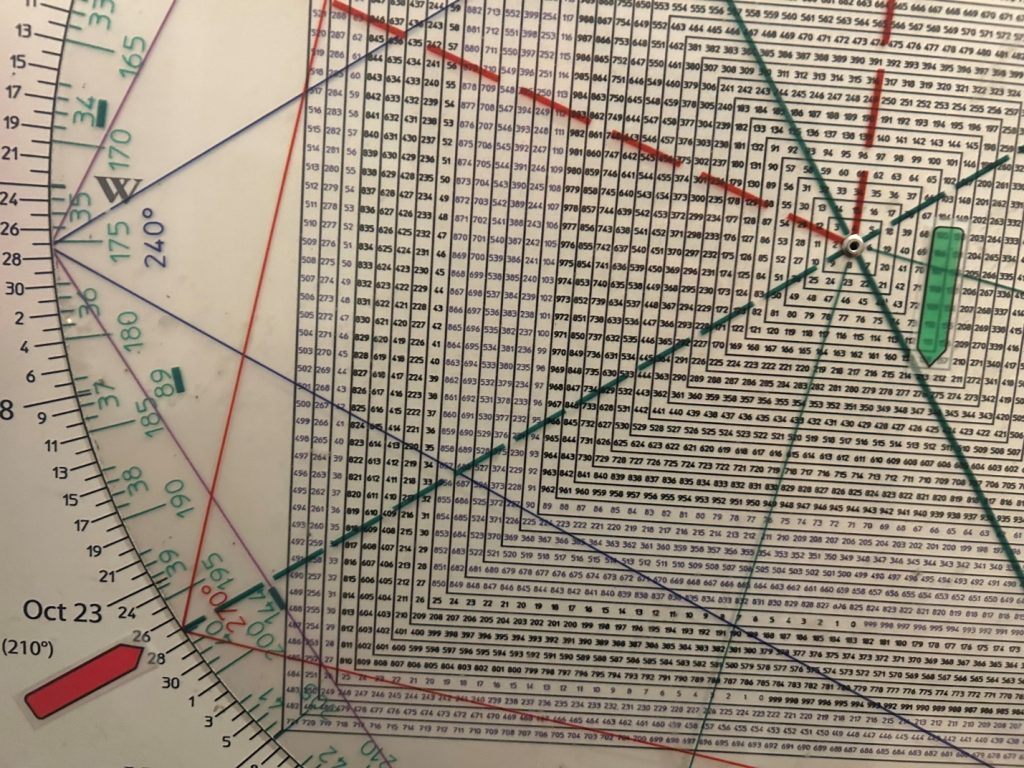
As well the 161 Oct low squares-out with April 5-8.
In sum, one factor that points to a crash this spring is that this April we are 94 ½ years from the October 1929 crash.
On the Square of 9 Wheel, 94 ½ squares April 8., the day of a powerful solar eclipse.
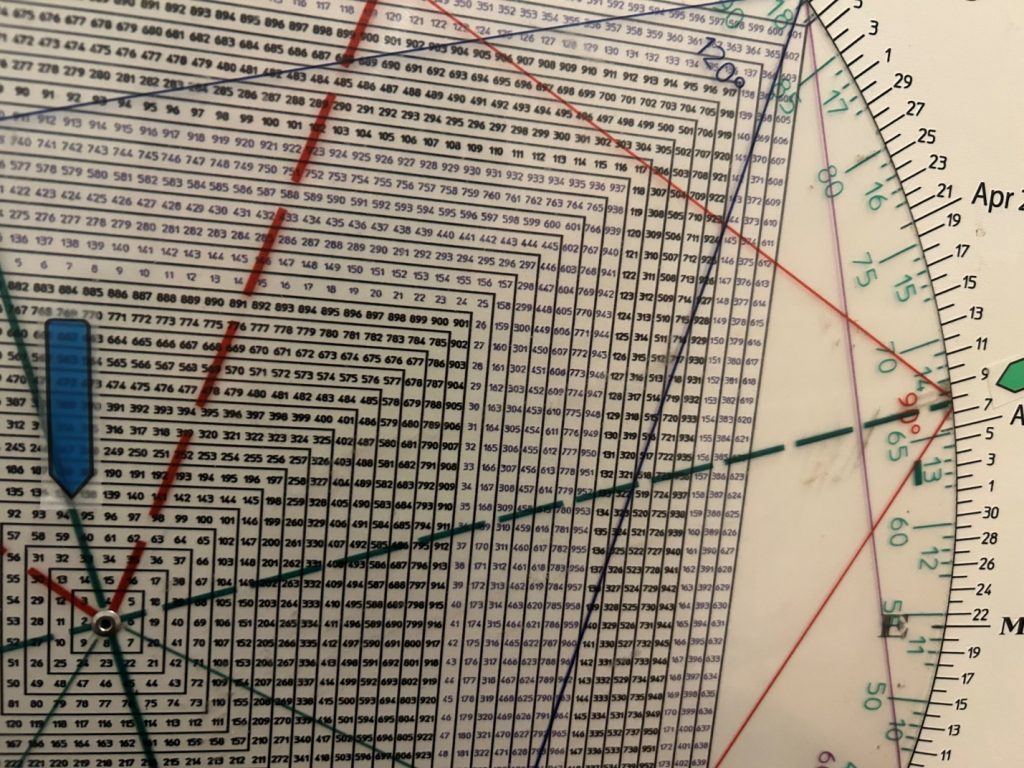
In fact on November 1, 1929 there was a solar eclipse.
The week prior, the wheels came off.
Eclipses can magnify whatever setup/structure is present.
Following the Great Crash of 1929 which bottomed in November that year, the market rebounded for 5 MONTHS INATO APRIL 1930.
A total solar eclipse occurred on April 30, 1930.
Is it possible a mirror image foldback from 1929 to 1930 is playing out with a low found last October and another runup into April for a key high?
I suspect the vast majority of market participants viewed the rebound into April 1930 as a “return to normal”, that the coast was clear.
The market was to embark on a 27 month relentless slow motion crash, bottoming 33 months from the initial crash in October 1929.
I suspect the vast majority of market participants believe the recovery since October 2023 has been a 5 month return to normal.
Of course the October 1929 crash did not materialize right off that year’s September 3rd high.
Most market participants will recite that old market saw that crashes don’t occur right off highs…that the market always offers a “graceful exit.”
It does not.
For example the market crashed directly off the February high in 2020.
Likewise it cashed directly off the January 2018 high.
Both were all-time highs at that time…just as was Thursday’s SPX record high.
Conclusion.
March 8th, 2024 may have marked an important internal high.
It ties to the anniversary of the March 10 NAZ all-time high in 2000.
It ties to the March 9th closing NAZ closing low in 2009.
March 2009 is 15 years ago which is ¼ or 90 degrees of Gann’s Master 60 Year Cycle.
Anniversaries of highs and lows were a significant arrow in W.D. Gann’s forecasting quiver.
Our roadmap since last December has been a basing period from December 21st for around a month followed by a series of spikes and gaps, up and down, within the context of an overall Runaway Move…until the 2nd quarter where a crash would show up.
This week will give us a lot of information as to when and where that event should start.
As noted, April 8 is a powerful eclipse just as there was on November 1, 1929.
Eclipses can magnify things.
Obviously not every eclipse turns into a crash. You need a bubble to have a crash.
Is the market extended? It’s been rising since 2009.
The weeklies from last Oct are vertical.
Is the market overvalued?
Legendary investor John Hussman thinks stocks like they’re in the most extreme bubble in history.
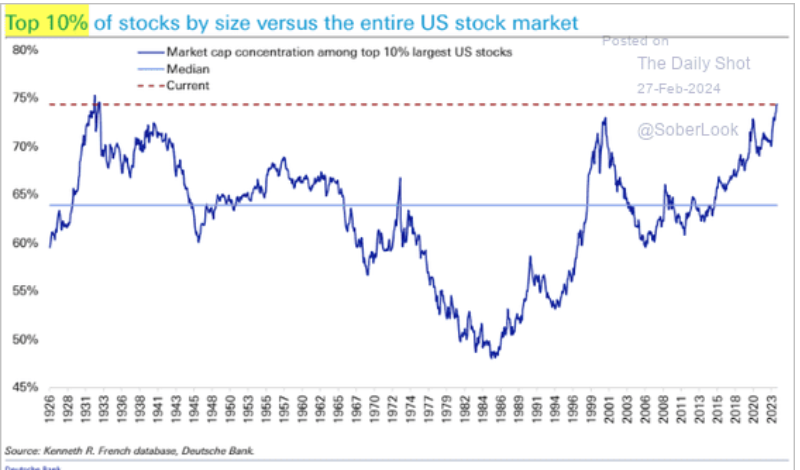
The current market cap concentration in the top 10% largest US stocks has only occurred one other time in history.
The factors to foment a crash are present.
Recently Hit and Run caught both 2018 crashes and the Covid Crash in 2020 writing on the day of the March 23rd low in 2020 that “my expectation is for the SPX to rally to 4000 in the next year.”
Timing is everything especially when it comes to navigating crashes when there can be massive countertrend rallies of 10% or more in a few days in the eye of a hurricane when the premium on puts can evaporate.
Hit and Run has been providing market timing and long/short daytrades and swing trades since 1996.
Our aim is to time this Big Kahuna.
