“Oh no it ain’t no use
Baby give it up, huh, turn it loose, ha” James Brown, Give It Up or Turn It A Loose
The McClellan Summation Index has been an accurate guide to major tops over the past century.
Following we’ll examine the pattern of the Summation Index immediately preceding the Bear Markets of 1929, 1937, 1962, 1973, 1987, 2000, 2007, 2020, and 2022.
Then we’ll analyze the current pattern of the Summation Index to see what history might teach us about what to expect for the remainder of 2024 and 2025.
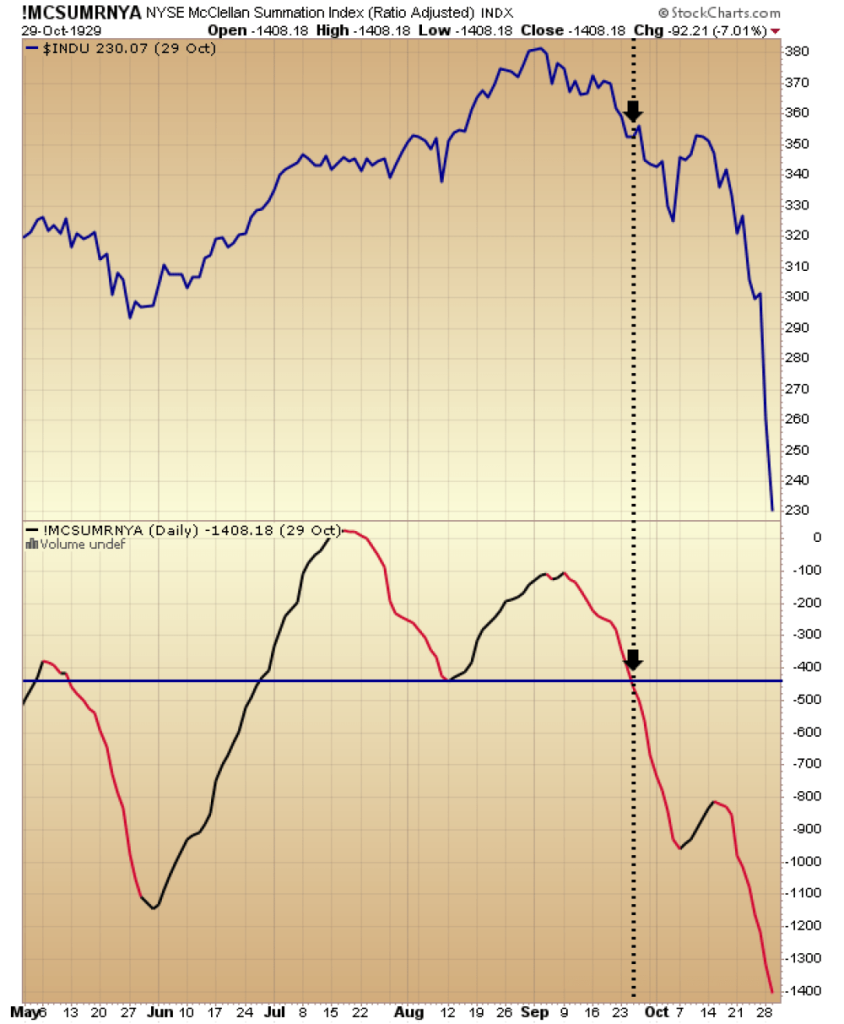
In the following images, pay close attention to the pattern of the Summation Index immediately before the onset of each Bear Market.
Notice how the breakdown of the upper pattern coincides with the beginning of a deep, sustained decline.
In many of these examples you will see a Head and Shoulders Neckline trigger the Bear. In others a triple bottom break (Rule of 4 Sell) before the Bear growled.
1929
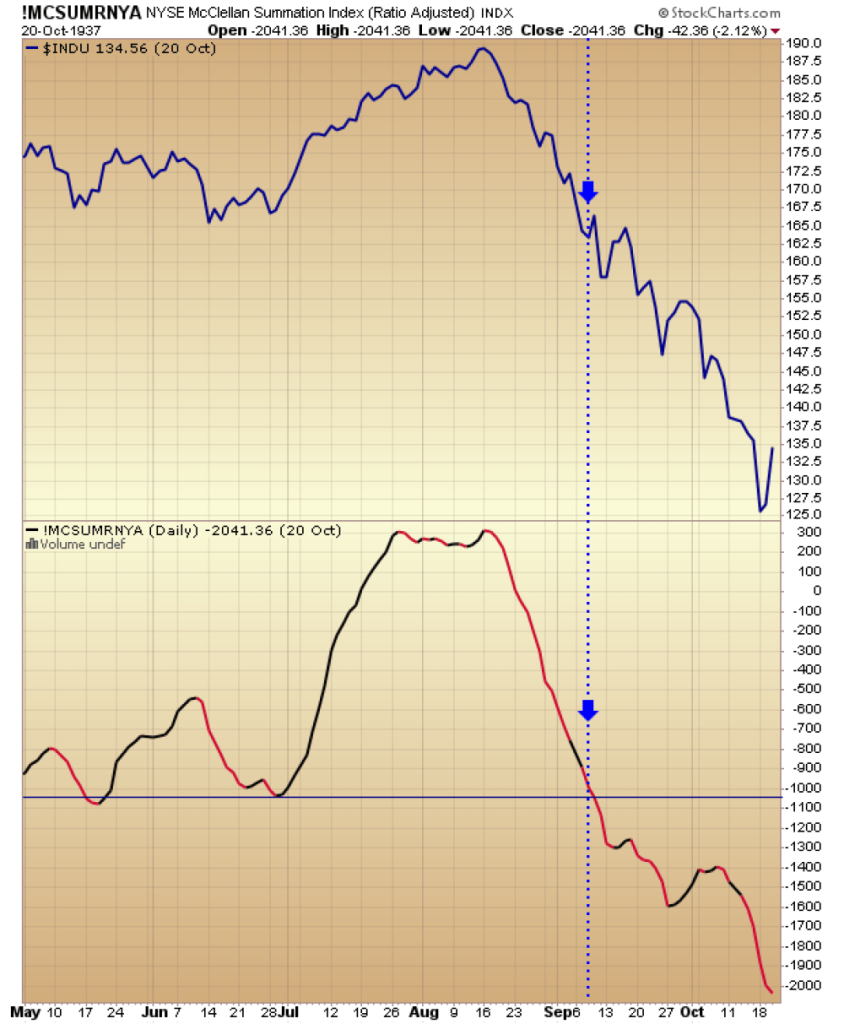
1937
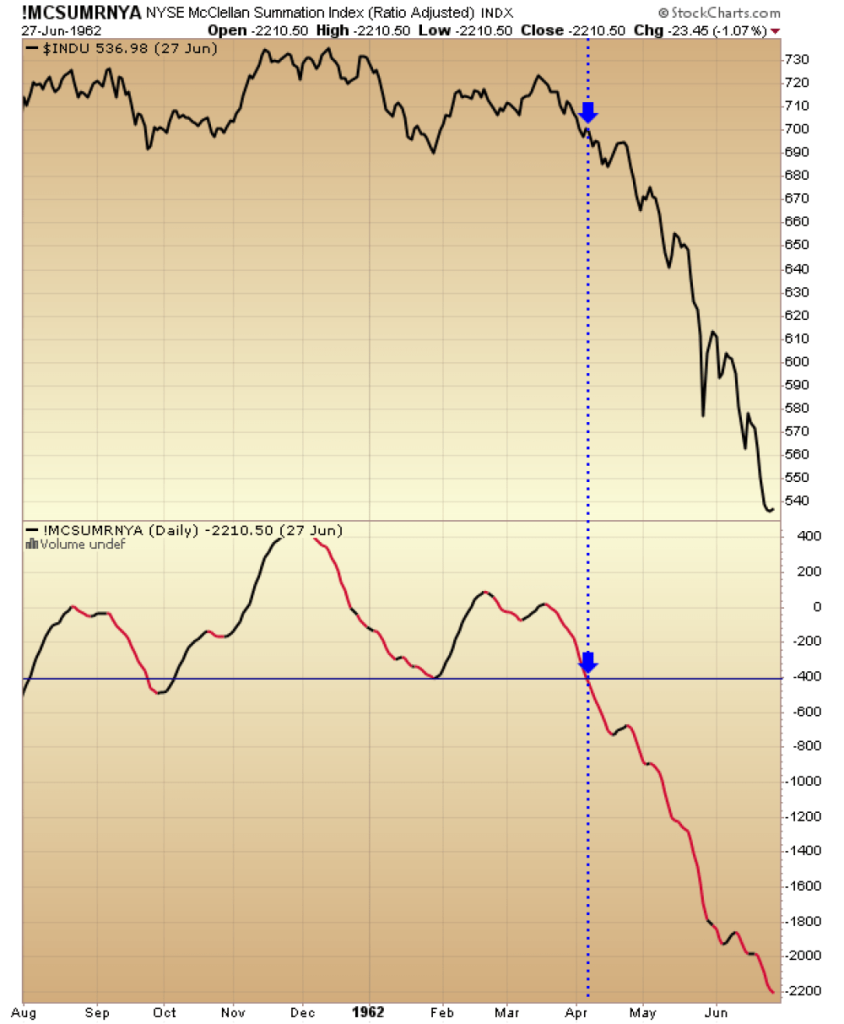
1962
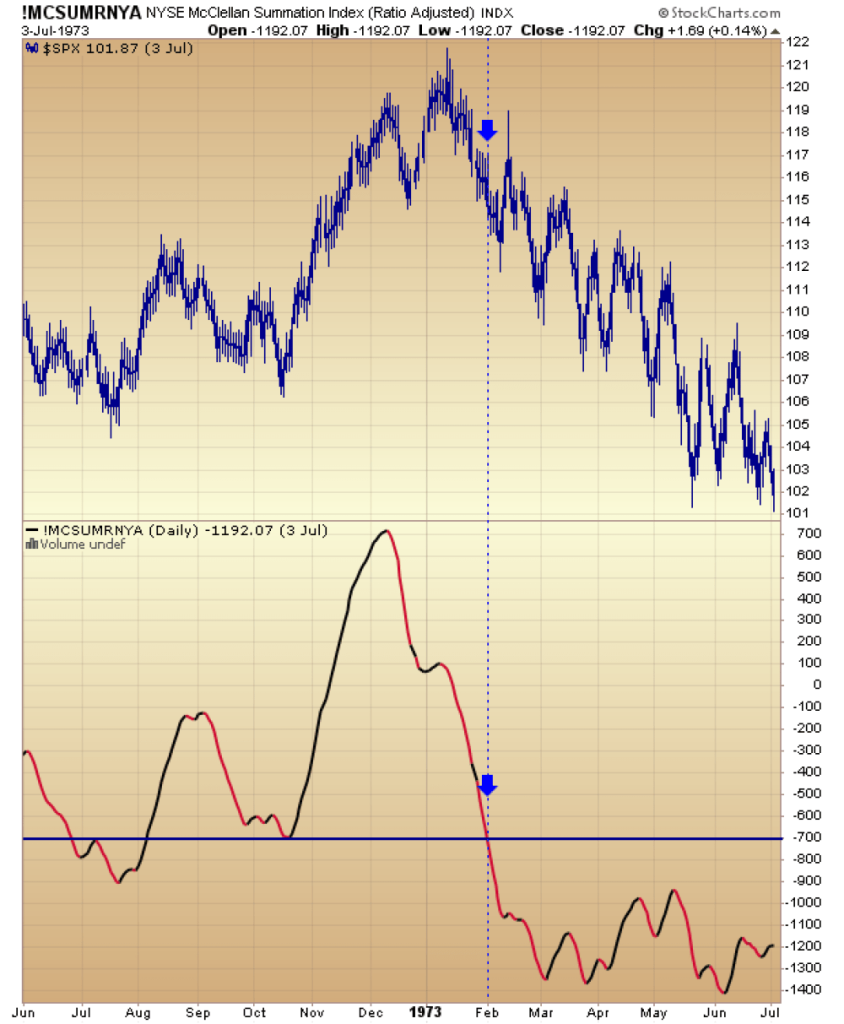
1973
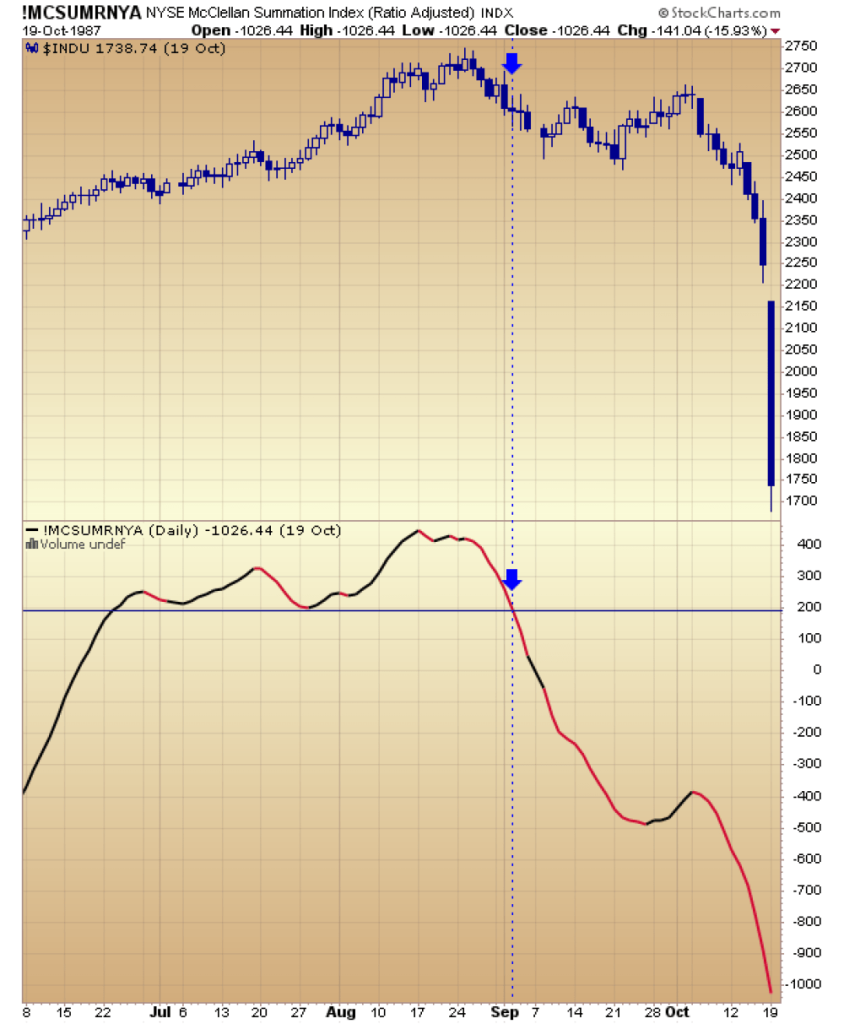
1987
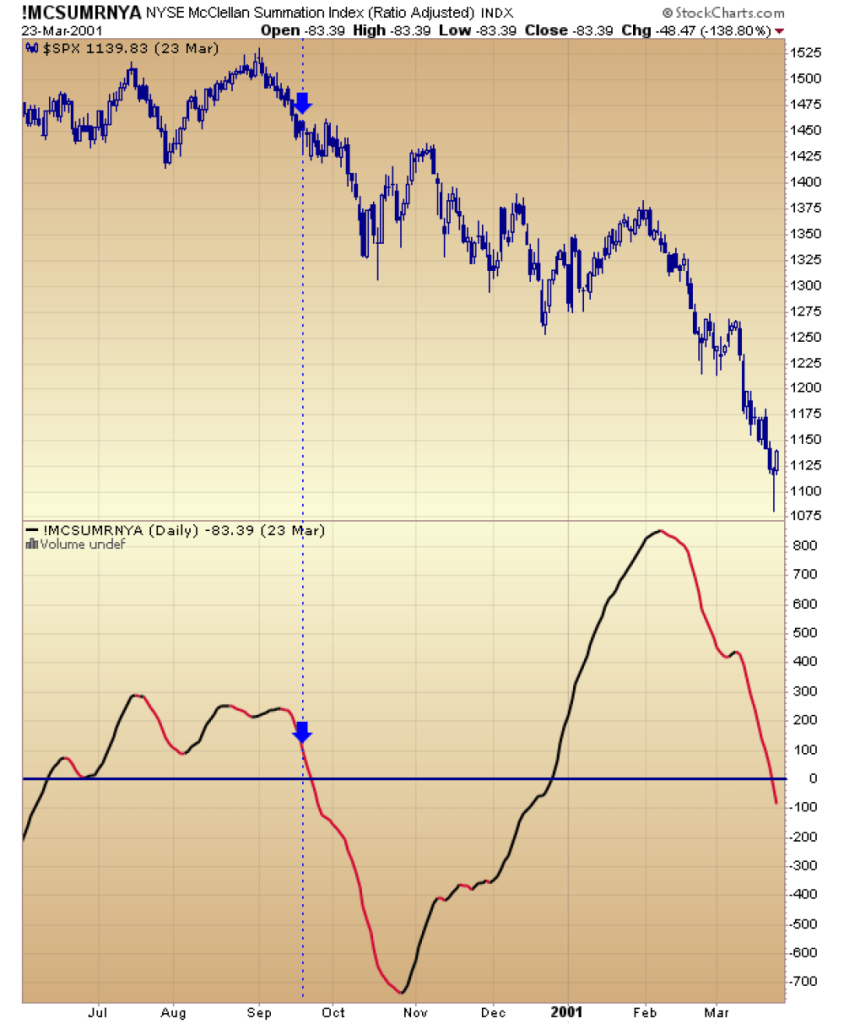
2000
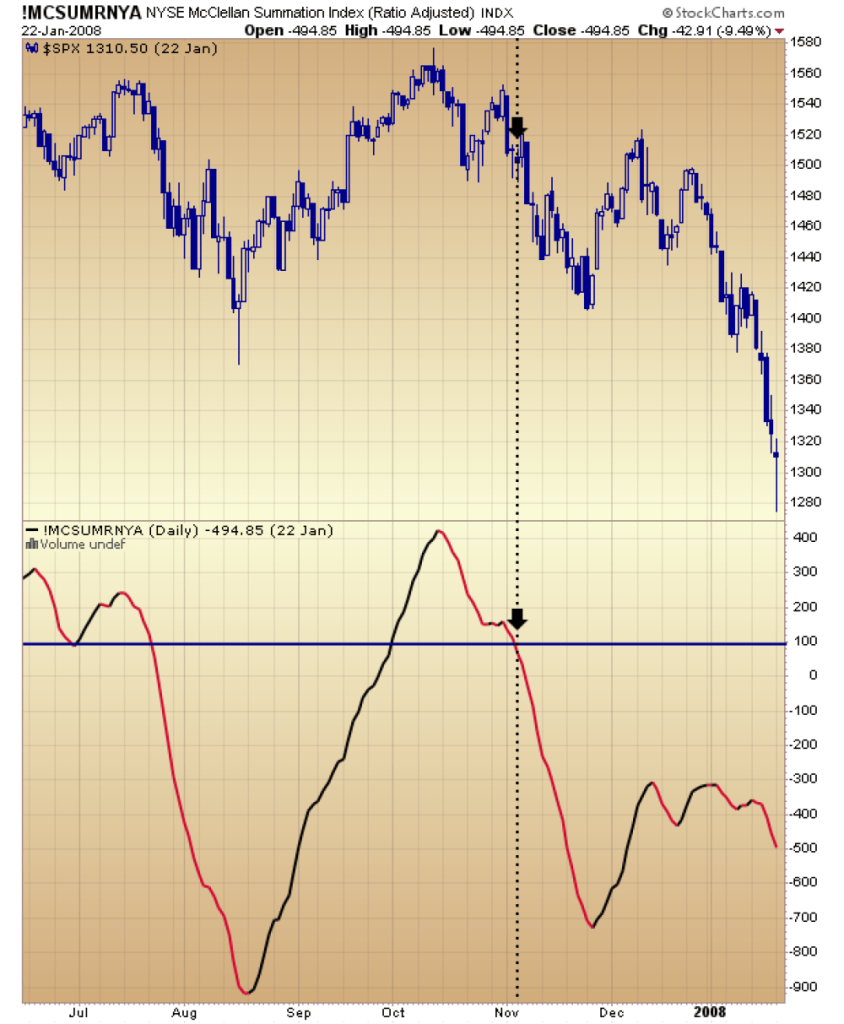
2007
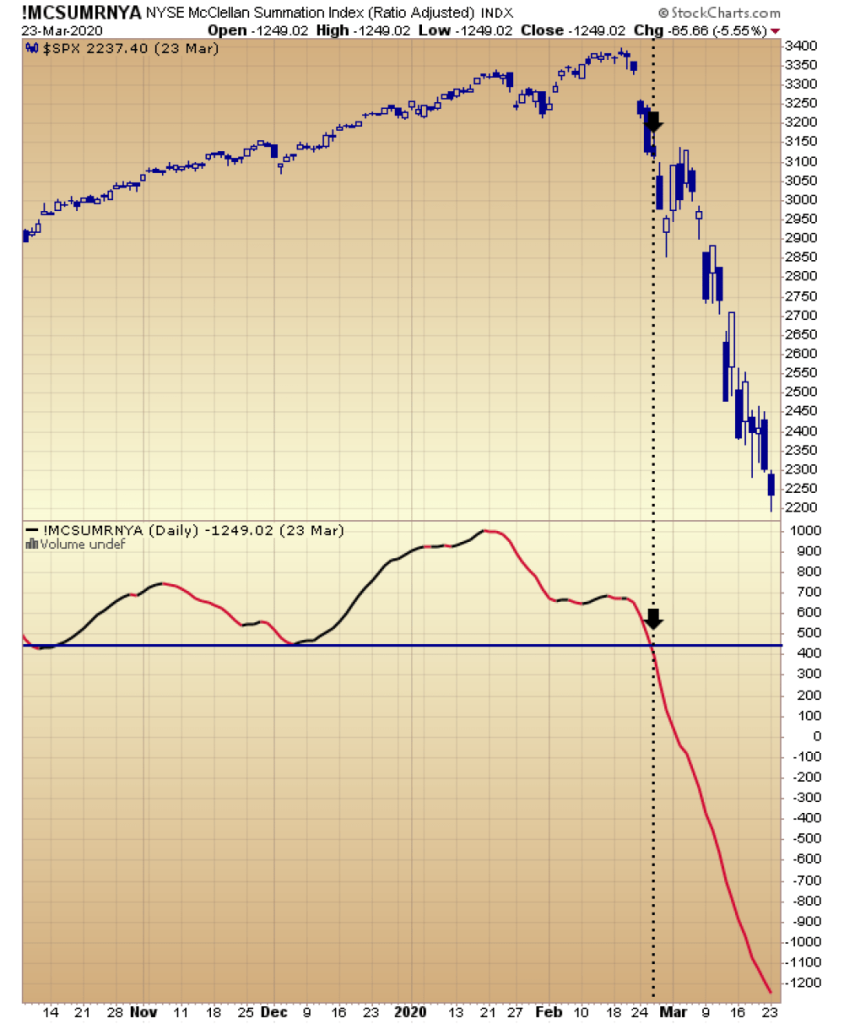
2020
2022
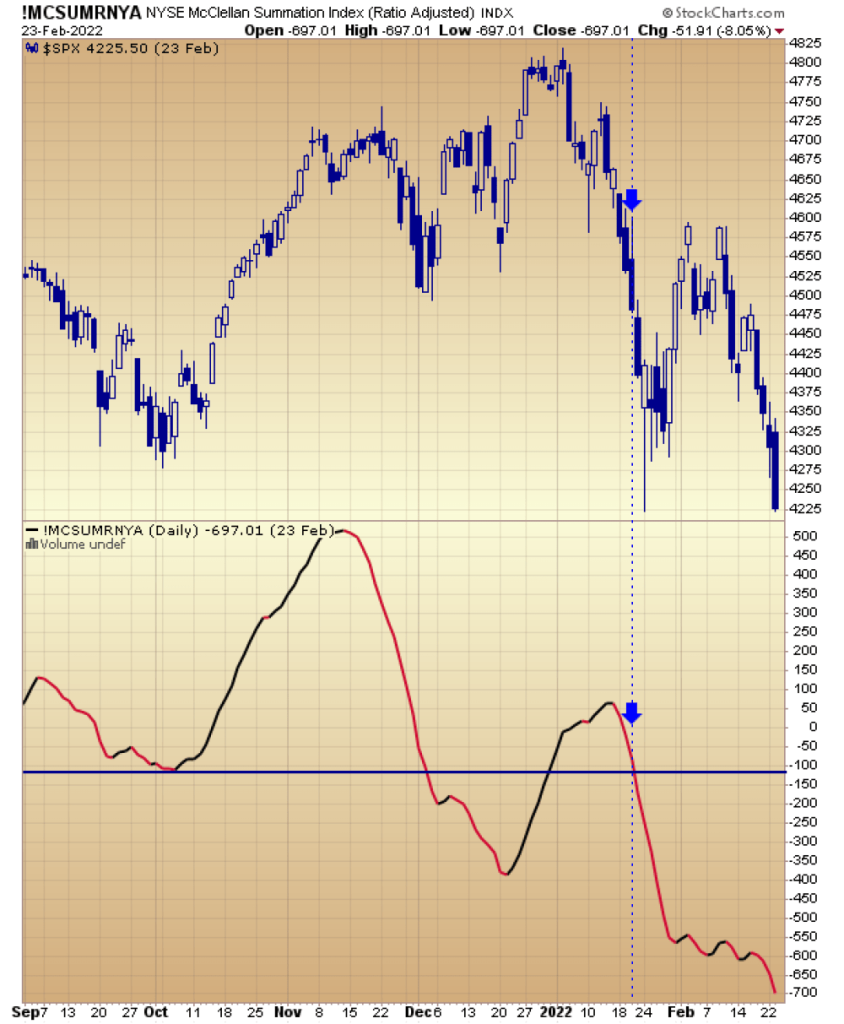
You can see that the Summation Index formed a top pattern over several months BEFORE breaking down below the lower boundary of that pattern—immediately triggering a bear market in each instance.
Now observe the chart of the current pattern thru last Friday, October 27th.
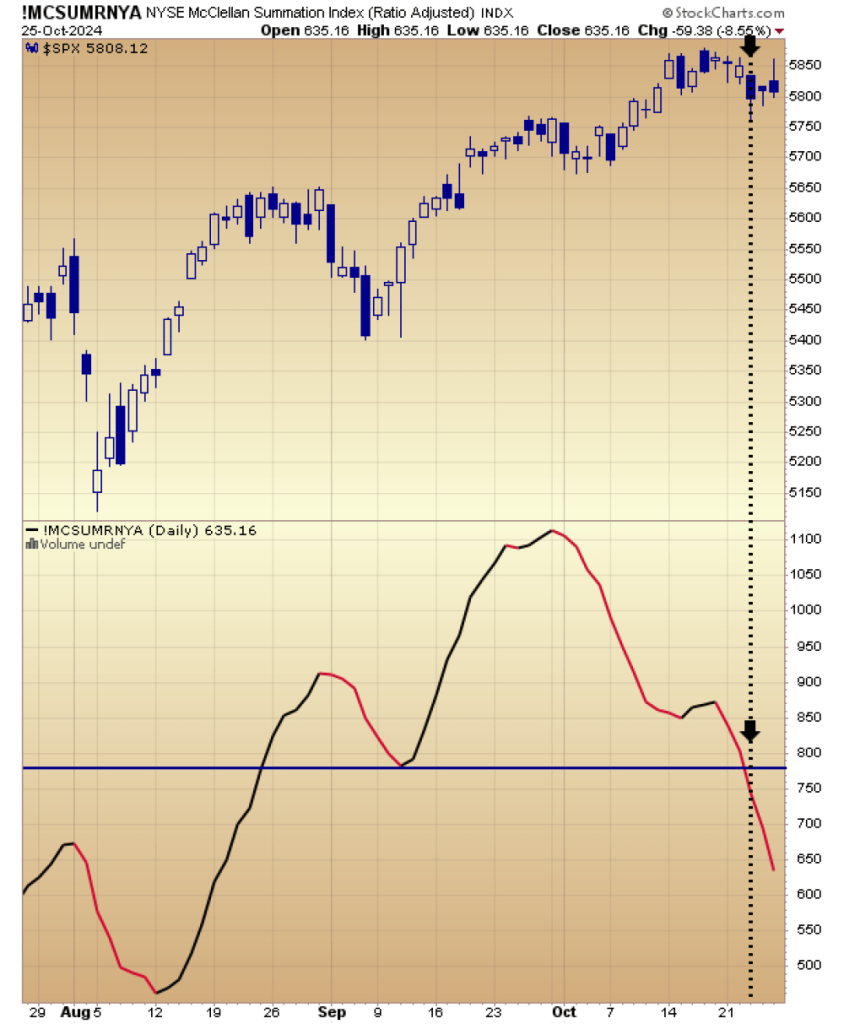
The same pattern that initiated the Bear Markets of 192o9, 1937, 1962, 1973, 1987, 2000, 2007, 2020 and 2022.
Drilling down we see that the current pattern most closely resembles those that market the beginnings of the Bear Markets in 1929, 1962,2000 and 2020.
While traders may have been encouraged that tensions in the Middle East did not flare up and escalate further over the weekend, it must be noted that the high of the day on Monday was reached in the first five minutes with the SPX closing on its low of the day.
In so doing, the SPX left an NR 7 Day, the narrowest range in 7 days. These contractions are typically followed by an expansion of volatility within a few days.
This is not hard to imagine with many of the Mag 7 reporting this week.
In sum, while looked like a fait accompli that the SPX would enter the -1/+2 sell position on Monday on trade above Friday’s high, it came up short.
Now the ‘clock’ has to be rejiggered if that setup is going to be satisfied.
Notice that the SPX 3 Day Chart is pointing down and from that turndown, the SPX faltered on the first turn up of the dailies.
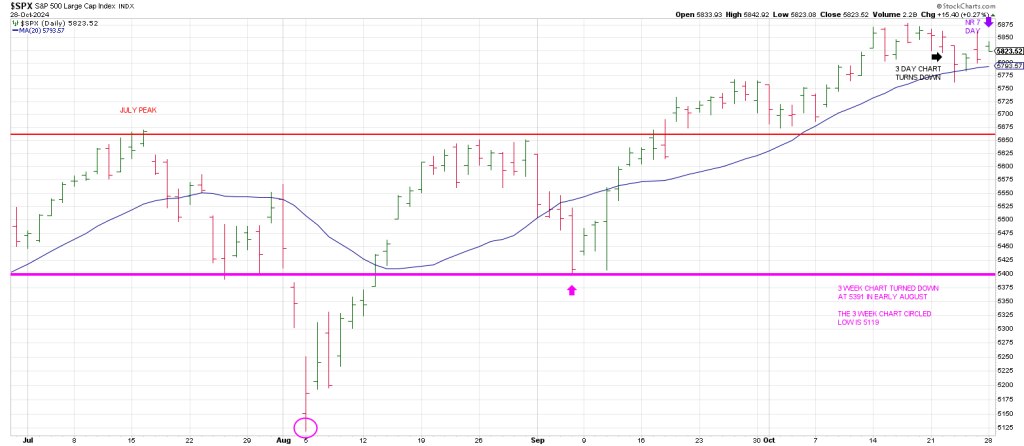
That is not a the kind of price action one would ‘normally’ expect if a blow-off to 6100 was on the table.
But we are still dealing with a high-level consolidation above the 20 day moving average.
The first sign that the message of the Summation Index is taking hold will be a failure below the 20 day moving average in tandem with breakage below the “circled” 3 Day Chart low—the 5762 low from October 23rd.
Until such time, either a breakage below the July peak or a rip to 6100, it’s an Algo’s World, squeezing premium out of puts and calls.