“People seeking answers to why the market plunged usually emphasize the immediate events that precipitated a selling panic, when in fact these events are but minor symptoms of much more severe underlying problems.” Seth Klarman
“Of all the mysteries of the stock exchange there is none so impenetrable as why there should be a buyer for everyone who seeks to sell. October 24, 1929 showed that what is mysterious is not inevitable. Often there were no buyers, and only wide vertical declines could anyone be induced to bid.” John Kenneth Galbraith
“Cycles and time/price harmonics suggest there is a likelihood for a test/undercut of the SPX 200 day moving average just ahead. If an air-pocket to the 200 dma is going to play out I think it happens over coming weeks. I also think there is the potential for one large range daily decline of around 5% and a multi-day drop of around 10%. A Flash Crash.
Currently the 200 day moving average resides at 4980. That represents a 10% downdraft.”
The above is from the Hit and Run morning report on Monday, July 29.
We went on to say: “there is a lot of synergy that suggests a plunging point of recognition looms:
July 30/31 squares October 29th, the big crash day in 1929.
July 30/31 is straight across and opposition the year 1987…another October crash.
As well there is a T-Square with all these points with the number 92.
92 years ago was July 1932, the Great Depression price low after the 1929 top.”
While there have obviously been 91 times July 31 has squared October 29th since 1929, the point is that the structure of the market looks to be culminating major waves from the 1932 low.
As well, the SPX topped precisely into our July 16th idealized time zone.
Why July 16th?
Two reasons: In addition to being the 34th anniversary of the July 1990 top with 34 being an important solar/lunar cycle which ties to Mid-East war cycles. July 16th aligns with 386.
386 is the DJIA pre-crash high in 1929.
Taking the price factor of the 1929 in combination with the time factor of 92 years off the 1932 low,
The presumption was major cycles were due to exert their downside influence.
Remember half this 34 year cycle is 17 years and nails the July 2007 Primary Top.
While many market participants were complacent expecting the market to run up into the end of the summer echoing the melt-ups in 1929 and 1987, we have expressed our thinking for months that a mirror-image fold-back to 1929 was on the table indicating a plunge into September versus a high.
Clearly the back of the parabolic run-up was broken last Thursday when the SPX left a large range outside down day (LROD) closing below its 50 day moving average for the third time in July and leaving little triple bottoms.
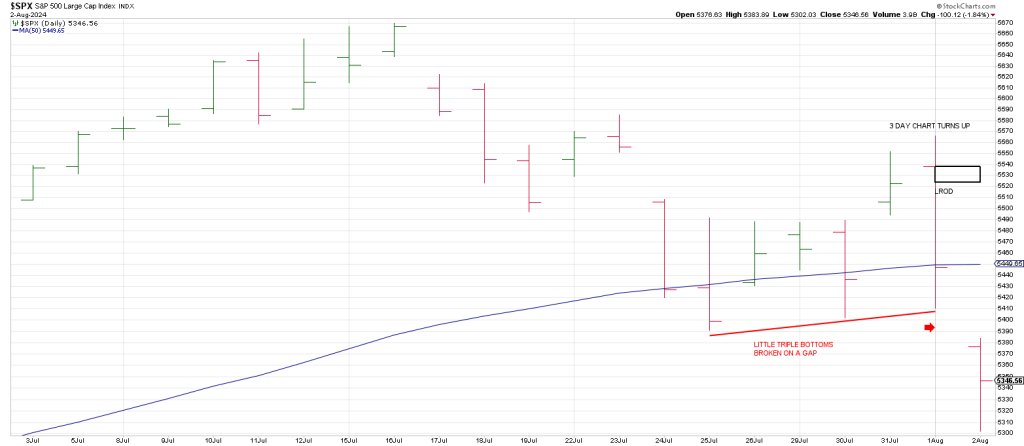
Thursday was a conspicuous point of recognition.
On Friday we got a Breakaway Gap below these little triple bottoms and a turn down in the Monthly Swing Chart.
The continued selling once the SPX monthlies turned down is bearish.
Likewise the close below the open gap from June 12th.
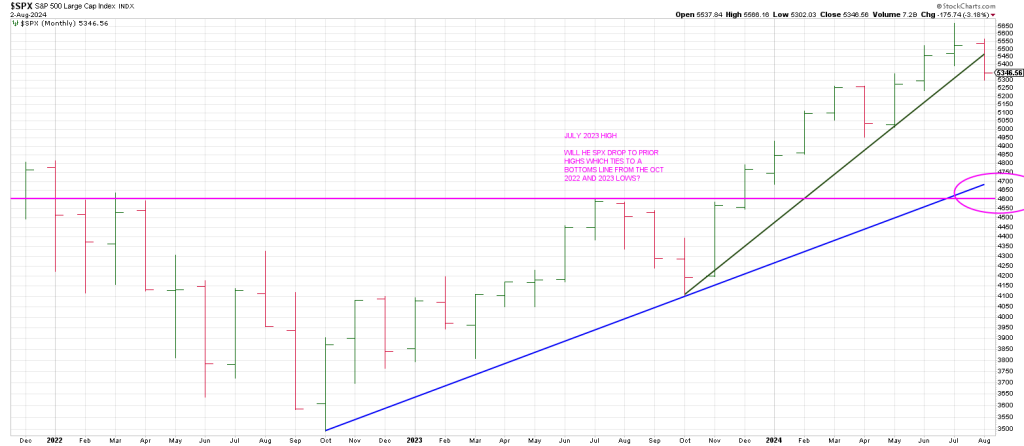
Downside follow thru after the turn down in the Monthly Swing Chart opens the door lower—especially as a clear 5 waves on the Monthly Swing Chart from the October 2022 low look complete.
In last Tuesday’s report we wrote the following:
“The SPX probed below a Bottoms Line from the October 2023 low.
That trend line has defined the trend for nine months.
While the week has just started Monday left a close below this trend line.
In other words a Friday close below this weekly trend line is a big deal.
Yesterday was a first step.”
We closed below the trend line in spades on Friday.
From Wednesday morning’s report:
“We’re getting another squeeze in the opposite direction of what short-term trend this morning as I write the futes are up 50 points.
This is the nature of extreme instability and volatility —the longs get squeezed, the shorts get squeezed. The market becomes a rag doll in a pit bulls mouth when the cycles break.
This “wax on-wax off” price action personifies The Matador…the Bull Killer.
He takes a while to get suited up. Those tights are easy to get on. Then there is the Dance of the Matador where he teases and taunts the bull before the denouement—inserting the sword.
The likely target is 5520 region. The overhead 20 day moving average which is rolling over is currently at 5540. An open gap is at 5550.”
Let’s look at what happened.
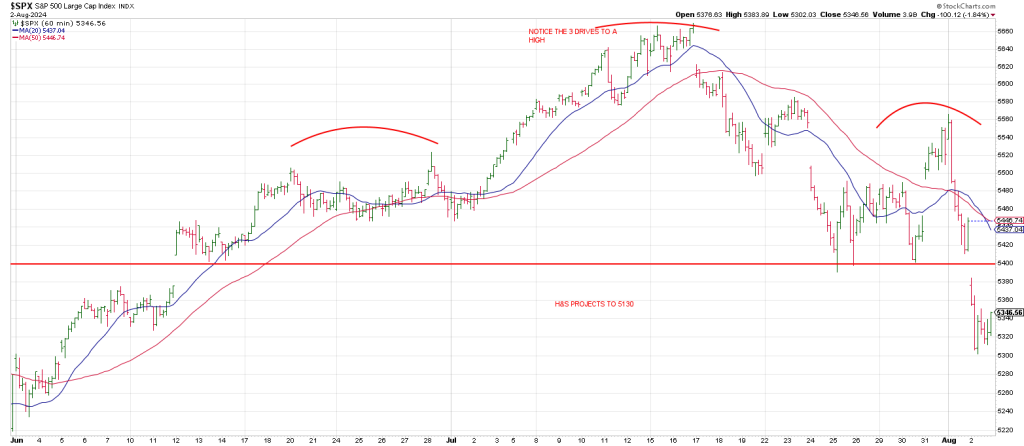
Place chart 4 here hourly SPX with 20 and 50 hour ma
The SPX Pinocchio’d the 20 day moving average pushing to 5550.
On Thursday, the SPX was up for all of 20 minutes before intense selling hit the tape.
The tip off to the reversal was a down ORB (Opening Range Break) in tandem with a Jump the Creek sell signal—breakage below the opening gap.
Thursday’s Lighting Rod (Large Range Outside Down Day/LROD) produced a blaring sell signal which produced a collapse below little triple bottoms and a turn down in the Monthly Swing Chart.
SPY puts that Hit and Run members purchased mid-week at .42 cents exploded to over $14.00 for us.
In sum the SPX closed perched on its rising 20 week moving average.
This elicited the low in April in tandem with a turn down in the 3 Week Chart…mirroring the same setup now.
I can’t help but think, “been there, done that”.
Be that as it may, Mr. Market dates Miss Direction.
I would not be at all surprised to see a short-lived bounce from some point today that rips the bears after a plunge lower.
As I tweeted to members in the last hour Friday, “look to trade shorts with the shorts on a bounce into the bell.”
In Thursday’s morning report, Sign of the Bear, we stated:
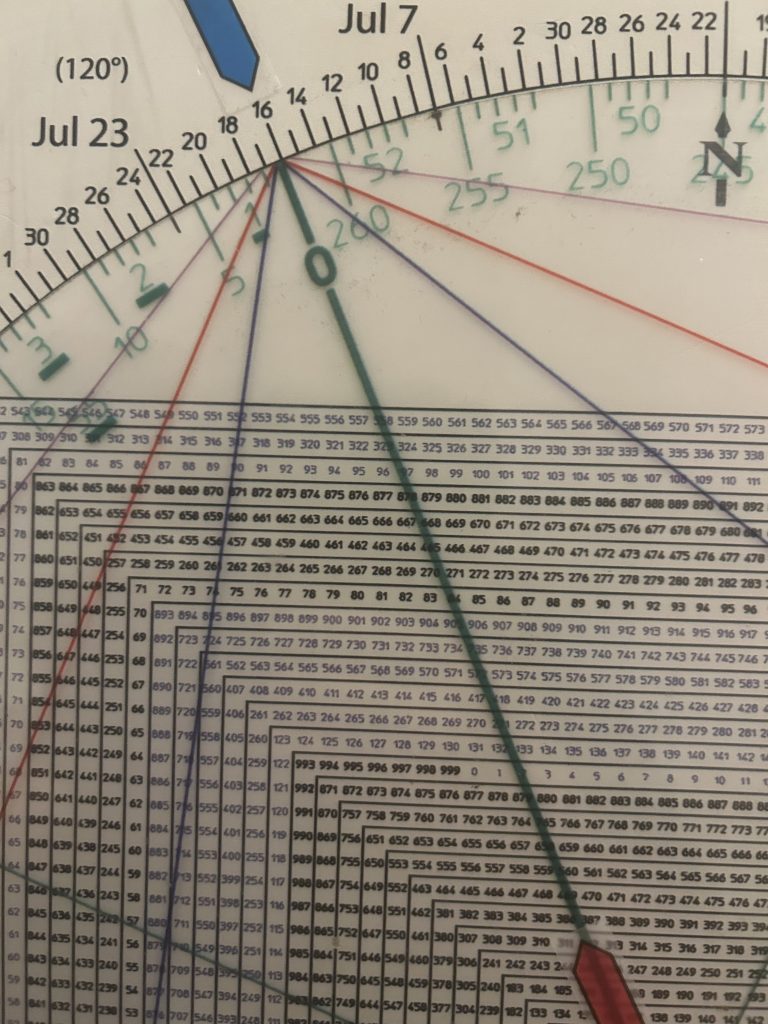
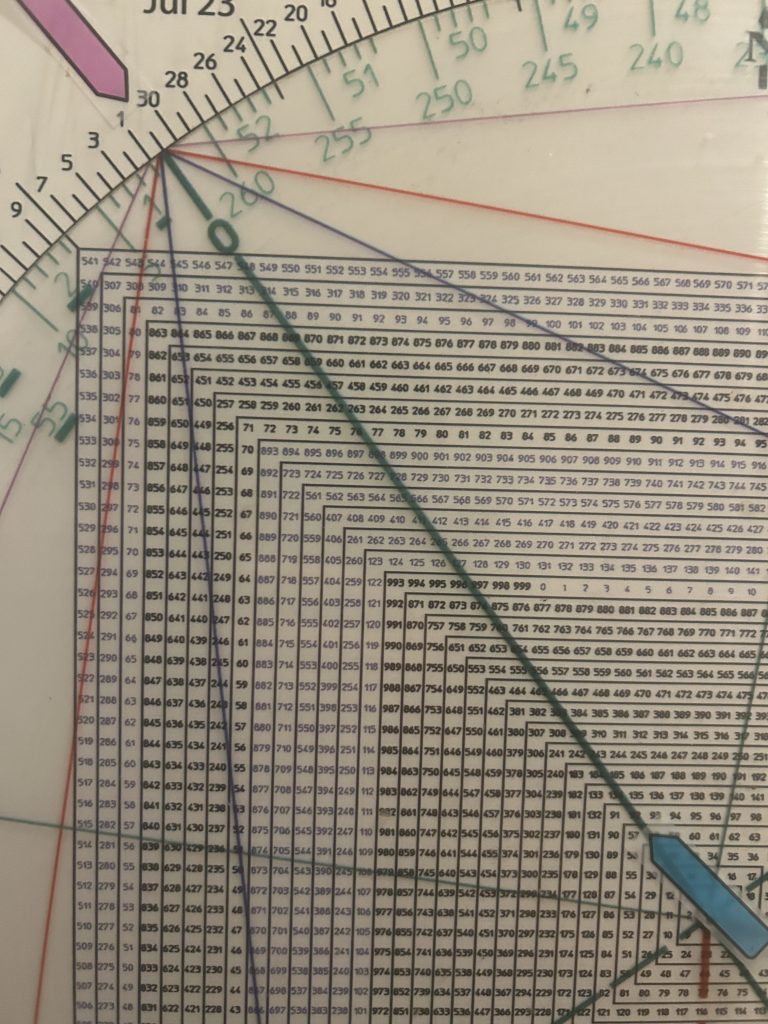
“The SPX struck a high of 5551 (555) on Wednesday.
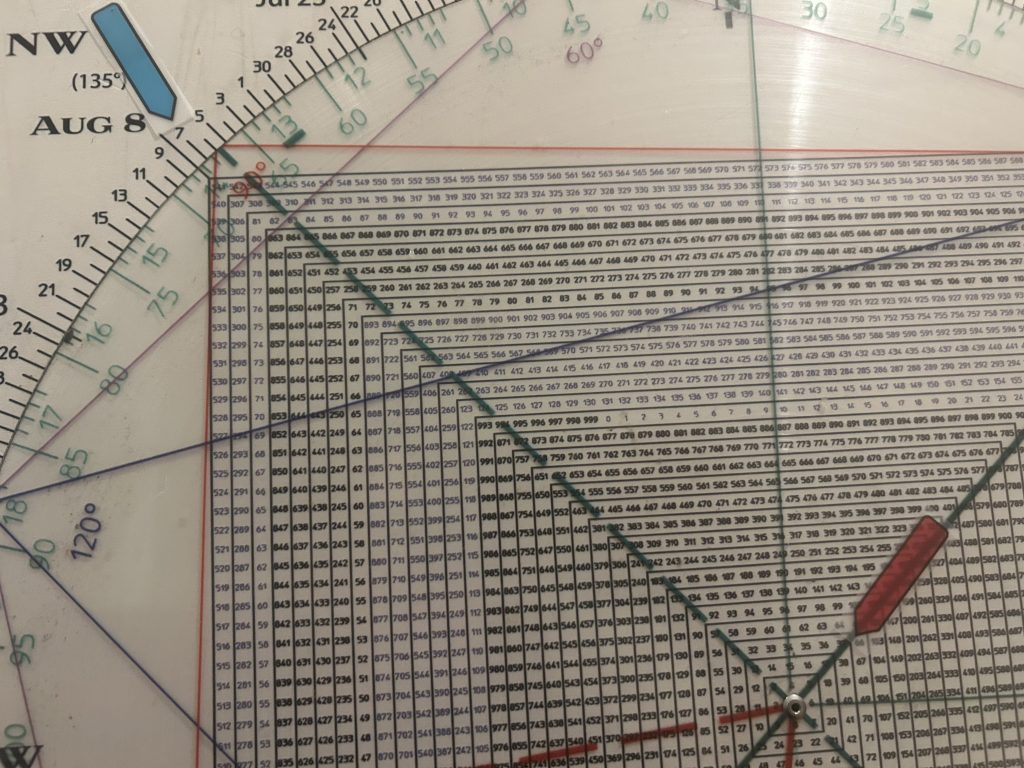
On my Square of 9 Time/Price Calculator 555 squares-out with July 31/August 1st.”
The takeaway was that the upside pivot.
We went on to flag “IWM’s 227/July 31st Time/Price square-out and Combo sell signal on Wednesday.”
It looks like the hoped for “Broadening-Out Trade” in the small caps is DOA.
In Friday morning’s report, Can Crashes Be Timed, we warned that “QQQ was threatening a Weekly Rule of 4 Sell signal, a break of a 3 point trend line and that it this was the first time QQQ had turned its 3 Week Chart down since the week of August 7th, 2023 with the Q’s continuing lower for nearly 2 more months. The structure and momentum off the July 2024 top indicates a strong likelihood that the Q’s will see a full 360 degree price cycle lower. 418 is 360 degrees down from the 503.50 all-time high. A drop to 418 is an undercut of the 200 day moving average currently at 429.”
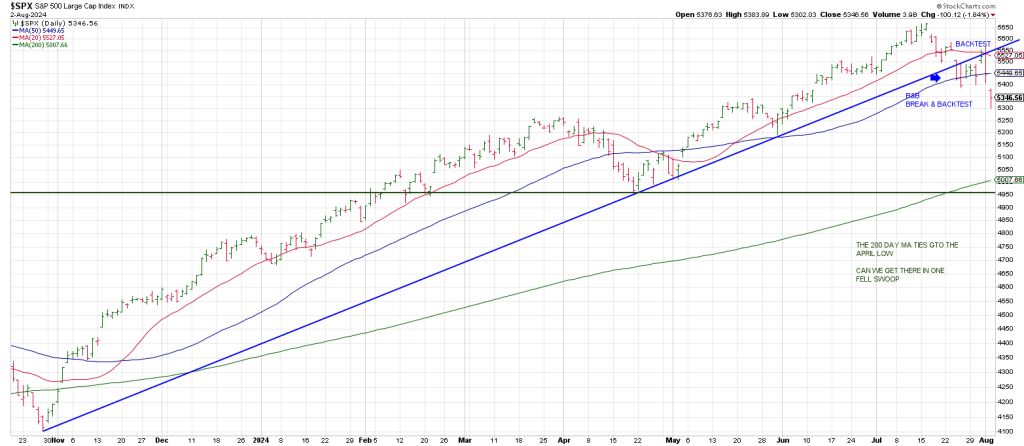
Given the downside momentum, is there any reason to think that the SPX and QQQ are not on the A Train to their respective 200 day moving averages?
The SPX 200 day moving average is at 5007.
This ties to the prior swing low, the April low,
The 200 day moving average hasn’t been tested since last October.
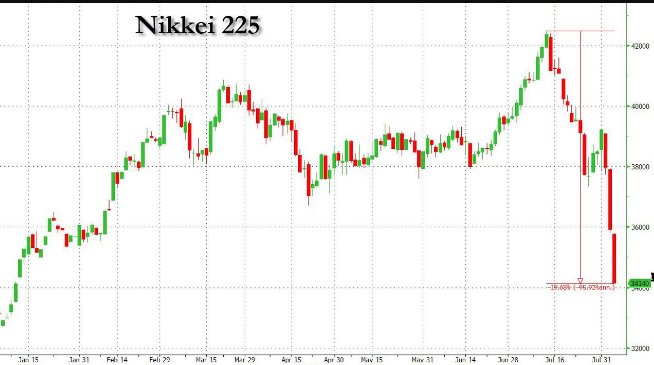
540 degrees down cubes out the high in the low 5200 region; however, given the waterfall decline in the Japanese market indicating an unwind in the generation long Yen Carry Trade, there is potential for a direct drop to the 200 day moving average.
Sunday night as I write, Japan is suffering its biggest two day drop in history, eclipsing Black Monday, 1987.
While The Hand doesn’t want to see a Black Monday (?), The Working Group may have jumped the shark.
As flagged in June, a 13 week blow-off from the mid-April low, mirroring the 13 week blow-offs in 1929 and 1987, points to mid-July.
We are 37 years from 1987.
August 5th-8 squares-out with 37.
Think the unthinkable
“Once a boom is well started, it cannot be arrested. It can only be collapsed.” John Kenneth Galbraith

Square of 9 Wheel
Purchase your own Square of 9 Wheel. Shipping to US only. Contact Jeff for shipping outside the US.