“As the history of the world proves, the truth has no bearing on anything. It’s irrelevant and immaterial, as the lawyers say. The lie of a pipe dream is what gives life to the whole misbegotten mad lot of us, drunk or sober.” Eugene O’Neill, The Iceman Cometh
“So let’s get to the point, let’s roll another joint
And let’s head on down the road
There’s somewhere I gotta go
And you don’t know how it feels
You don’t know how it feels to be me.” You Don’t Know How It Feels, Tom Petty
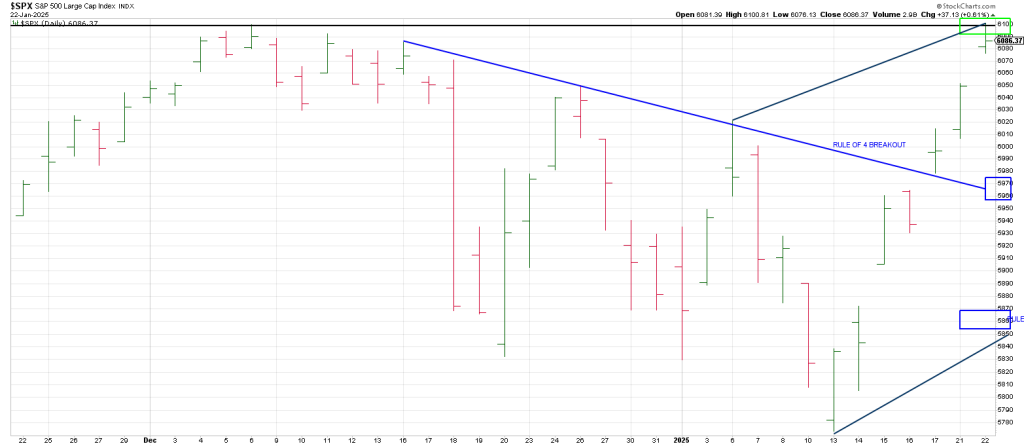
The SPX left an NR 7 Day on Wednesday. This is the narrowest range in 7 Days.
As well it was the 7th trading day off the low.
These narrow range contractions typically see an expansion of volatility within a few days.
So fireworks can be expected.
Yesterday we walked through the POTENTIAL square-out at 6160 ish.
If we’re going there over coming days, my expectation is that it happens after a shake-out.
Maybe a deep shakeout.
The pattern I am looking at is the one from January/February 2020 because of the 5 year cycle.
The drop off the January 2020 peak was just under 4%. It was after that pullback that the SPX set it’s Bull Trap pre-Covid Crash peak in February.
A near 4% drop from 6100 takes the SPX back to the mid-5860 region.
As you recall this ties to 270 degrees down.
It ties to the initial Breakaway Gap on January 15th.
Is Phil D Gap suited up?
Yesterday we discussed the potential synchronicity between historic manias, panics and crashes and how February appears to be in the crosshairs.
Tomorrow we’ll take a look at the anniversary dates of those events to see if they also ‘vibrate’ off this January/February time frame.
But tonight I want to look a possible harmonic relationship between the Great San Francisco Earthquake and devastating fire and the devastation in Los Angeles.
Tonight I just got yet another email from So Cal Edison that they may turn my power off tonight.
I hope to get this report out to you quickly.
Today there is another wild fire just outside of Los Angeles.
The Great San Francisco Earthquake was on April 18, 1906
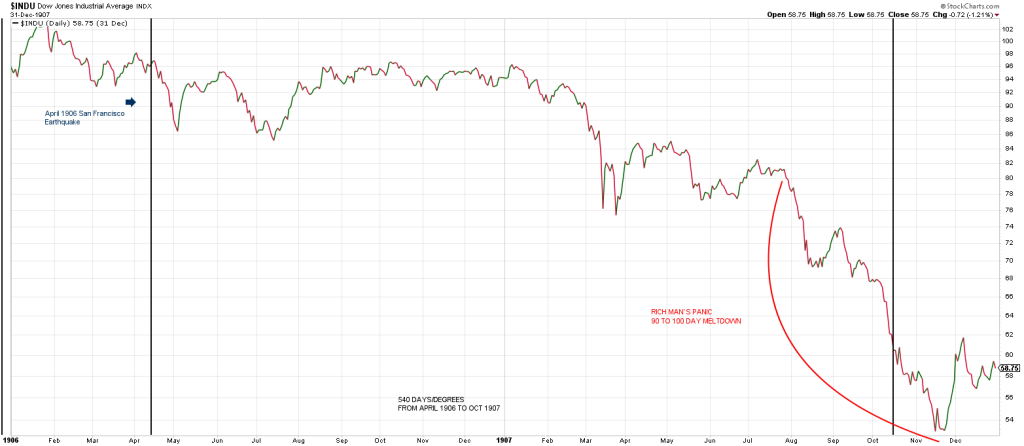
Notice that the low of the Rich Man’s Panic started 540 days/degrees later in mid-October 1907.
The NYSE fell almost 50% from its peak the previous year.
The free fall part of the crash started on the week of July 8, 1907, bottoming on the week of October 11, 1907.
W.D. Gann knew what he was talking about when he pointed to the significance of anniversary dates.
July 8th, 1932 would be the price low of the Great Depression.
October 11th would be the peak in 2007 prior to the Great Recession.
You can’t make this stuff up.
It is fascinating the low in 1907 cubes out with the panic of the April 1906 San Francisco Earthquake.
In other words the 1907 panic was 540 days/degrees following the April 1906 Earthquake.
Here in January 2025 we are 540 degrees from the important July 2023 peak.
Is it possible that 18 months (540 days/degrees) from the Great Los Angeles Fire the market will be in free fall in the summer of 2026?
540 degrees is a cube in time and in price.
I discovered the significance to this 18 month period and 540 degrees in price doing research for my seminar in 2005, Unlocking The Profits of the New Swing Chart Method (available on DVD) which analyzes every major move in the SPX from 1941 thru 2004.
I had always thought that 360 degrees in time and price was the MacDaddy.
But in researching that period I was amazed to see how many major moves were 540 degrees in price (up or down) and/or time, 18 months.
I knew there must be a reason.
Then it dawned on me that 540 degrees is a true square.
A true square is a cube which has 6 sides of 90 degree angles.
90 X 6 = 540.
I’ve probably read everything that Gann has written more than once.
Nowhere do I recall him mentioning “cubes”.
Given Gann’s cryptic and enigmatic style, we can be sure that since he mentions squares and square-outs all the time, that the absence of the word cube is intentional…and important.
The bottom line is that since we are 540 degrees/days late this January from the 2023 top that this is yet another factor indicating a major turn is on the table.
The manic moves in many names in the last week punctuated by several spike and reversal patterns on Wednesday underpins the notion of climatic price action.
What we know that the 7 week Gann Panic Zone that opened the door to a waterfall decline this week is instead seen panicky buying.
Names such as ORCL, FN, ARM, GEV, CDNS, CLS, CRS and COHR to metion a few, underscore the manic tape.
Is this part and parcel of a healthy and continuing Bull Market?
Yesterday the SPX struck a new all-time high by the smallest of margins above its December 6 peak.
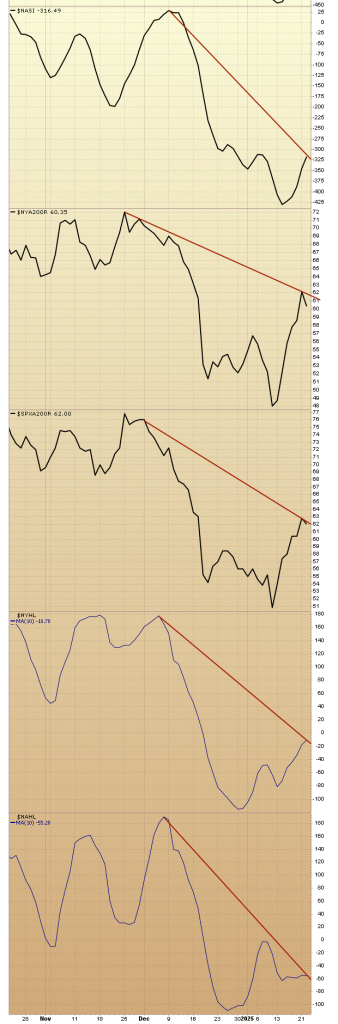
A healthy ongoing Bull Market validates a new high through confirmation by cross-market averages and internal market metrics, including:
1) The Advance/Decline Line
2) Transportation Average
3) IWM
4) The McClellan Summation Index
5) The NAZ Summation Index
6) The percentage of NYSE stocks above their 200 day moving average
7) The percentage of SPX stocks above their 200 day moving average.
8) The 10 day average of daily new highs on the NYSE
9) The 10 day aveage of daily new highs on the NAZ.
However, yesterday’s nominal new SPX all-time high was sent a blaring alarm that was a dog whistle to most market participants.
Unheard.
As well, the SPY closed on a Time/Price square-out:
606 squares out with Jan 22.
As shown in the charts below every cross-market and internal measure failed to confirm yesterday’s new high milestone—not just marginally, but by the widest margin of failure in recorded history.
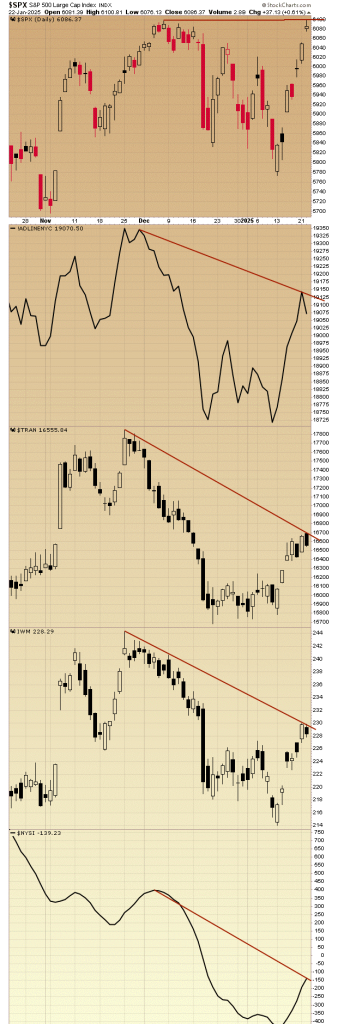
In sum, the momentous theme at any major top is failure, failure to confirm.
The SPX cannot continue to SUSTAIN an advance without confirmation from internal momentum and cross-market support—any more than a general could win a war without his troops.
The current massive set of divergences doesn’t mean we won’t see additional tests and potential pushes beyond the 6100 region in coming days.
Clearly we’ve seen momentous divergences riddle the tape at many market turns and the market extended —UNTIL IT DIDN’T.
That’s why Gann said, “Time is more important than Price.”
Don’t tell me what or why but WHEN divergences will matter.
This is why I went through the exercise of looking at the synchronicity of the possible cyclical harmonics with prior historic phenomenal turns in the market in yesterday’s piece.
The divergences mean that the SPX does not have the support needed to sustain a prolonged advance.
Think of it as an professional ice skater on the thin ice of a lake behind his house.
They’ve skated on it numerous times when the temperature had risen.
No problem….until it one day gives way.
The Ice Man cometh.