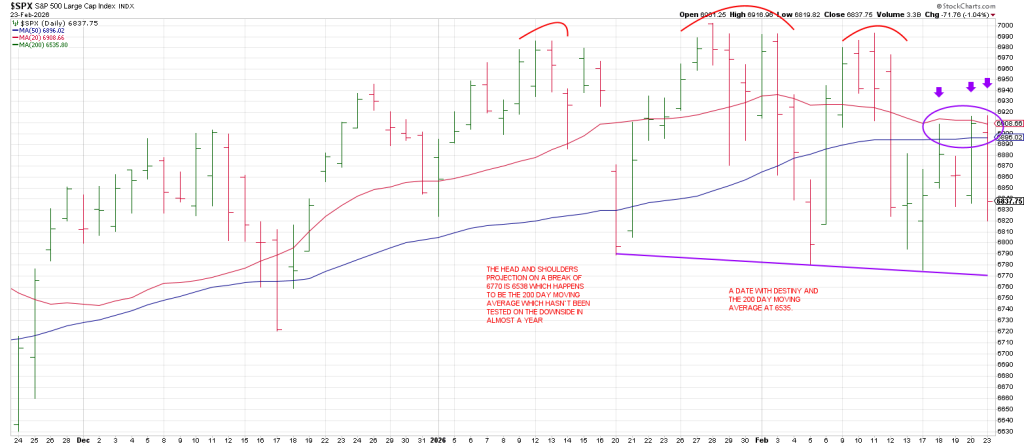
The SPX has been playing cat and mouse with the 6750-6770 region since mid-December.
They’re gonna need a GOAT stick save to prevent a slide through this level.
Despite Bloody Monday in tech land, the SPX remained above the pivotal 6770 level.
That said it was the third backtest of the 20/50 day moving average Bowtie in 4 days.
The next push should flush this support.
There is a Head and Shoulders projection on a break of support to 6538. The 200 day moving average is at 6535.
Can you say “date with destiny”?
it looks like the SPX is carving out a Bear Flag prior to a triple bottom break (Rule of 4 Sell) of 6750.
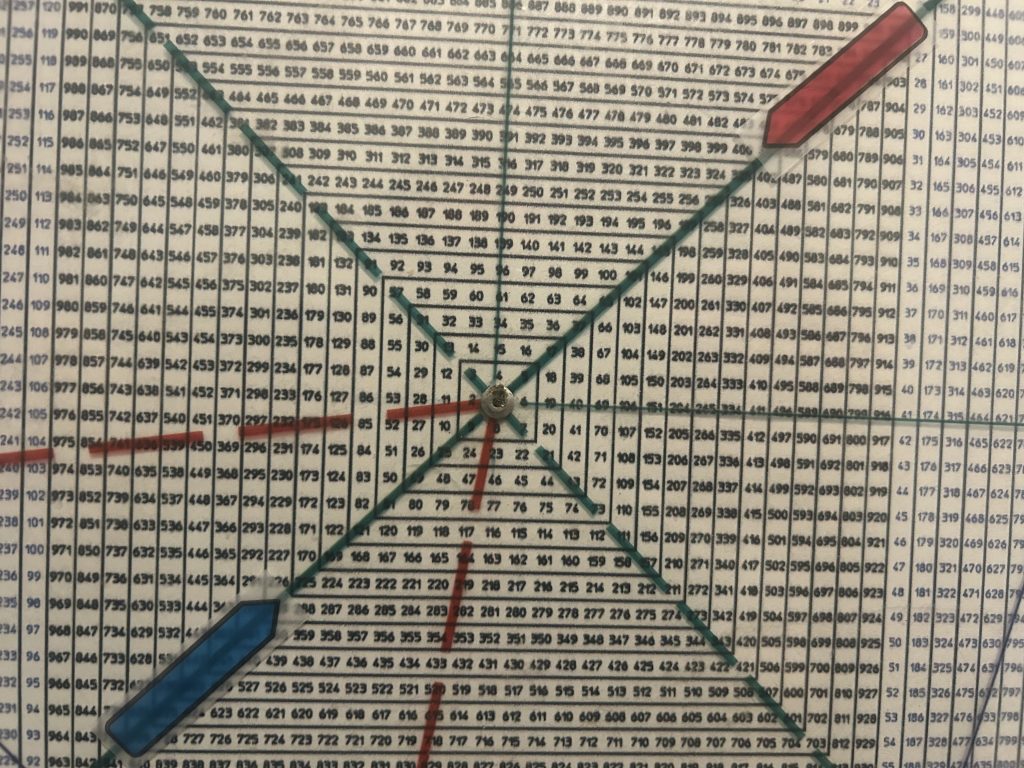
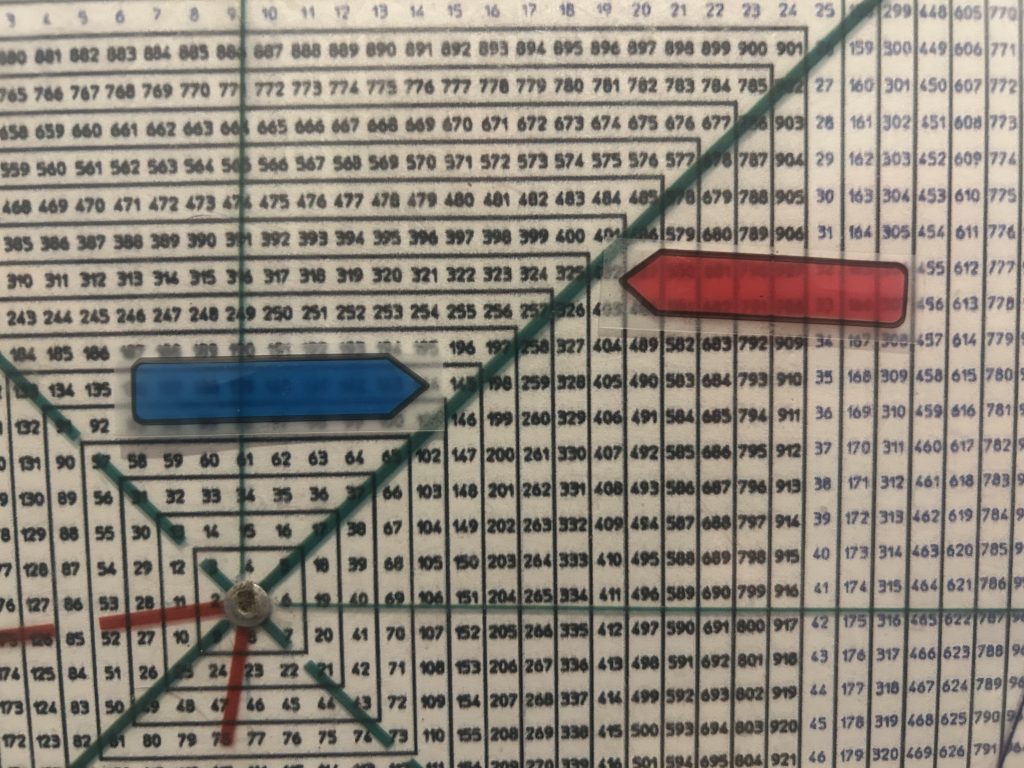
Let’s take a look at how this aligns with the Time and Price geometry of the Square of 9 Wheel.
Interestingly 675 (6750) is two price cycles of 360 degrees up from the April low 482 (4820).
The mid-point or one cycle up from low is 575 or 5750.
This ties to the Breakaway Gap in May 2025 so there is some good synchronicity for a drop to 5750.
Checking a monthly SPX shows that the Monthly Swing Chart turned down on Feb 17.
The normal expectation when that occurs is to get a Knee Jerk reaction—in an underlying bear trend.
In a Bull market, a turn down of the monthlies should define a low soon, in terms of both time and price.
Trade back below the monthly turndown of 676.57 is a bearish event.
Especially with downside follow through.
That should perpetuate break of the 6750 region.
It must be said that the Monthly Swing Chart turned down in November and we got the presumed kick to the topside and new all-time highs.
That was then, this is now.
This second turn down in the monthlies should see the second mouse get the cheese for the bears as to the indices—as many stocks have already been obliterated.
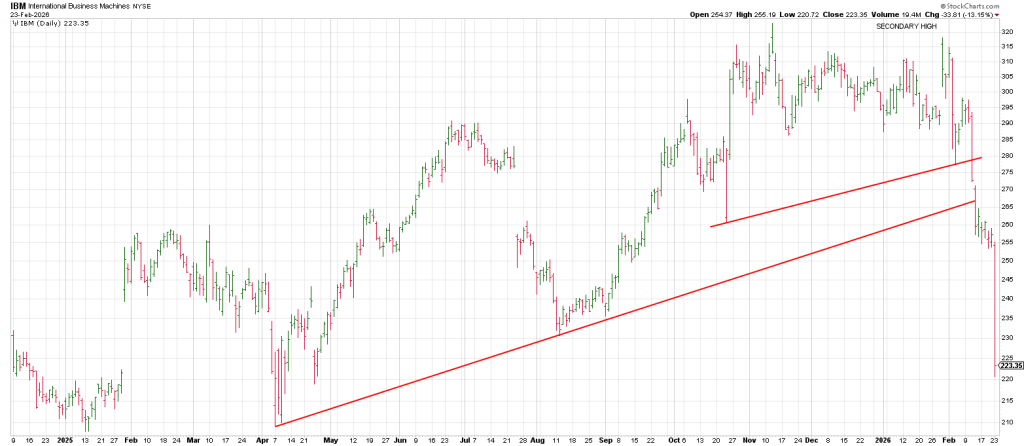
To wit, IBM just had its worst single day in a decade—down 13.14% in a DAY. That’s the worst % selloff since its IPO in 1968.
“AI names ramp while software names collapse. This dispersion is what produces Hindenburg Omens indicating a high number of 52 week highs and new 52 week lows simultaneously amid a widening divergence in market breadth.
Multiple Hindenburg Omen signals have been registered in early February 2025 reflecting underlying weakness in the market.
There were also a cluster of HO’s in early November 2025 which coincided with the sharpest downdraft since the April 2025 low.
Not all HO signals lead to a crash, but few crashes if any have occurred without Hindenburg’s on the table.”
Above is from Monday’s Hit and Run Report.
Monday’s action triggered another Hindenburg Omen. This is the 5th HO in the past month.
Hindenburg’s have a 20-25% accuracy rate for predicting significant declines.
So what’s the big deal?
Well, clusters of signals (in any methodology) are far more meaningful. They have preceded the 1987 crash, the 2000 dotcom bear, the 2008 debacle and the 2020 covid crash.
What has my attention is that this cluster is occurring in February 2026, a month we’ve projected to be a major turning point.
Our article simply titled “February 2025” from January 15th is proving to be eerily prescient.
In the article we noted that a secular bull market started in June 1949 and culminated 17 years later in FEBRUARY 1966.
We are 60 years (Gann’s 60 Year Master Time Cycle) from 1966 and 17 years from the 2009 low.
Interestingly the Dotcom Buying Climax in late 1999/early 2000 ties to a 17 year period starting in the summer of 1982.
Gann made his 60 Year Cycle famous after the 1929 crash when he revealed that one of the factors in his forecast in January 1929 to “look for panicky conditions in the fall” was that 60 years prior there was a panic in 1969.
My goal is not to make a forecast but to allow you to access the real potential danger.
In sum, the SPX struck a Primary High on October 29th, 2025.
A Secondary High came a geometric 90 days/degrees later on January 28.
W.D. Gann stated that the best and safest place to enter a short is on confirmation of a Secondary High.
The SPX closed below its 20 week moving average on Monday—not by much—but for the first time since reclaiming it after the April 2025 low.
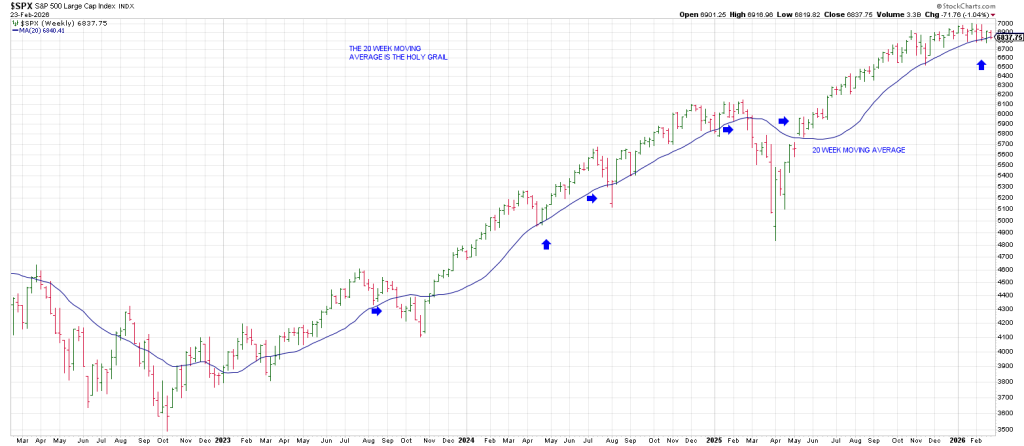
Downside follow through warrants caution.
IBM is going to be a tell this week as it satisfied a 540 degree decline from its 325 peak in November to 225.
540 degrees is an important measure as it is a true square…a cube.
Why? Because a cube has 6 sides of 90 degrees.
In researching my video course Unlocking the Profits of the New Swing Chart Method, I was amazed to find how many major turning points were 540 degrees in price or time (18 months).
TEAM’s most recent swing high was also 325.
It went through 540 degrees down (225) like a hot knife through butter.
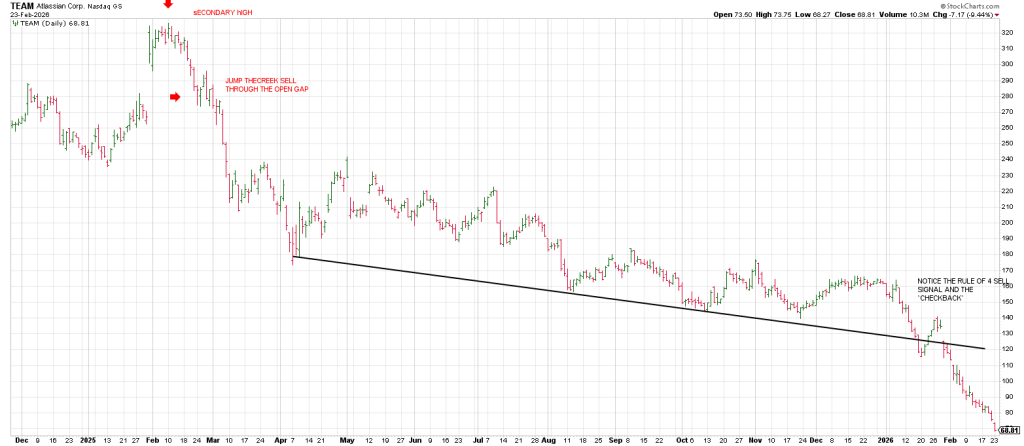
3 cycles of 360 * down is 145.
3 X 360 is two cubes.
6 cycles of 360 * down is 37.
That’s a 90 % drop from TEAM’s all time high of 483 in October 2021.
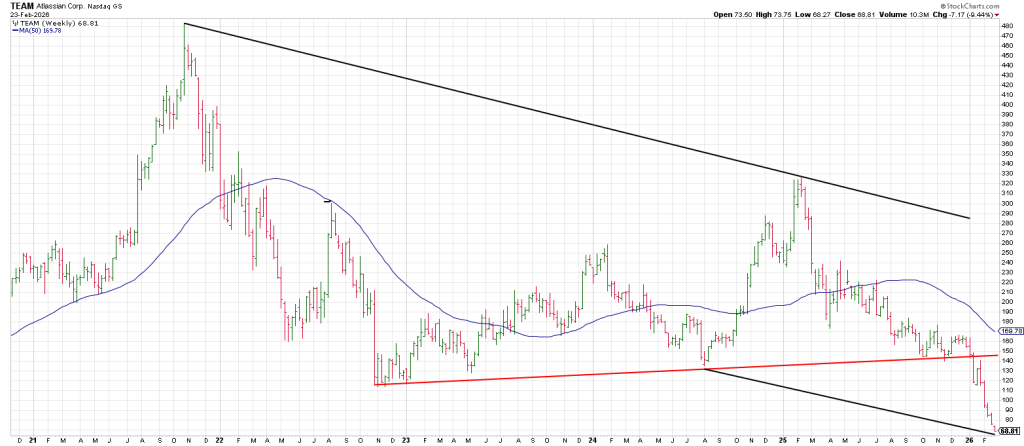
Remember this chart when you’re tempted to buy the dip.
Particularly stunning is the meltdown after my Rule of 4 Sell signal on the monthlies at 140 in January.
TEAM has lost 50% since that signal.
There’s no such thing as too low, or two high because funnymentals go out the window when Mr. Market gets a whiff of panic.
Conclusion. Last Friday was monthly OpEx. The SPX followed our ‘road map’ projecting Mr. Toad’s Wild Ride that delayed the anticipated correction.

Square of 9 Wheel
Purchase your own Square of 9 Wheel. Shipping to US only. Contact Jeff for shipping outside the US.