“Cause I was feeling so logical
Yeah
D-D-D-D-D-D-D-Digital” The Logical Song, Supertramp
18 years is the Saros or Eclipse Cycle where similar eclipses occur.
The Earth, Sun and Moon are in almost the same relative positions.
19 years is the Metonic cycle where the phases of the Moon recur on the same days of the year.
Reportedly, WD Gann constructed a Financial Time Table based on these two cycles.
The two cycles average length is 18.6 years or the cycle of the North Node of the Moon.
18 years ago in July 2007 markets struck a Primary High.
They dropped sharply and rallied back into a marginal new high on October 11 where the index left a Key Reversal Day marking the Secondary High.
2007 was the last major bull market high.
18 ½ years from July 2007 gives January 2026.
Within the context of the 18 year cycle is the 18 month fractal or 540 days/degrees.
This is a cube in time.
In July 2024 the market struck a top which was point 1 in a 5 point Megaphone Top pattern.
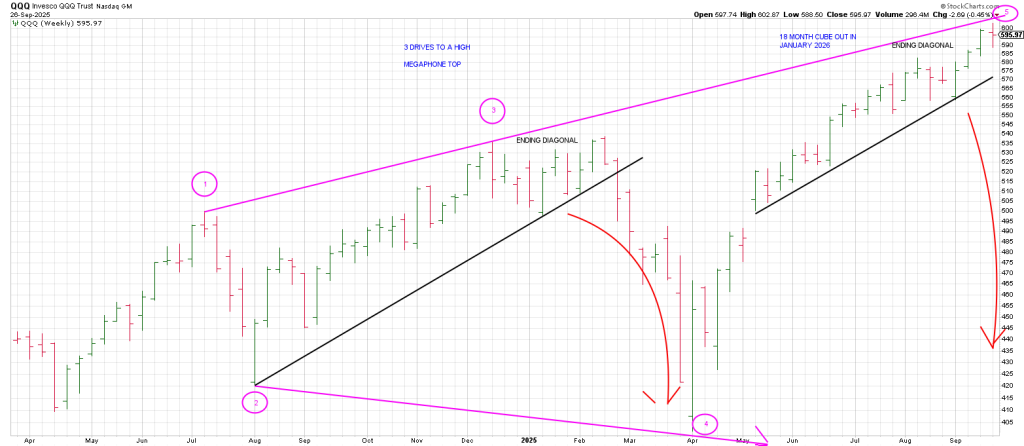
As you can see the Q’s appear to be completing point 5 of this 18 month Megaphone or Broadening Top pattern.
Notice that point 3 completed an Ending Diagonal or Rising Wedge which led to a crash in the spring of 2025.
Currently it appears that another Ending Diagonal is in progress.
Breakage below the QQQ 570 region should perpetuate a waterfall decline at least as large as the 2025 spring crash.
18 cube-out months from the July 2024 peak is January 2026 which coincides with an 18 1/2 year periodicity from July 2007.
It is interesting that while the market topped in early October 2007, it backed and filled pressing lower until January 2008. As soon as the opening bell rang on 2008 the real selling started in earnest.
Whether the market can hold up until January 2026 remains to be seen.
Early October is an historical period.
It marked the bear market low in 2002.
As offered above it marked the bull market top in 2007.
In 1987, October 4 marked the last pivot high prior to the October 19th crash that year.
As shown below, in 1929, October 4 marked a pivot low in the downturn off the high which when broken signaled the Big Kahuna.
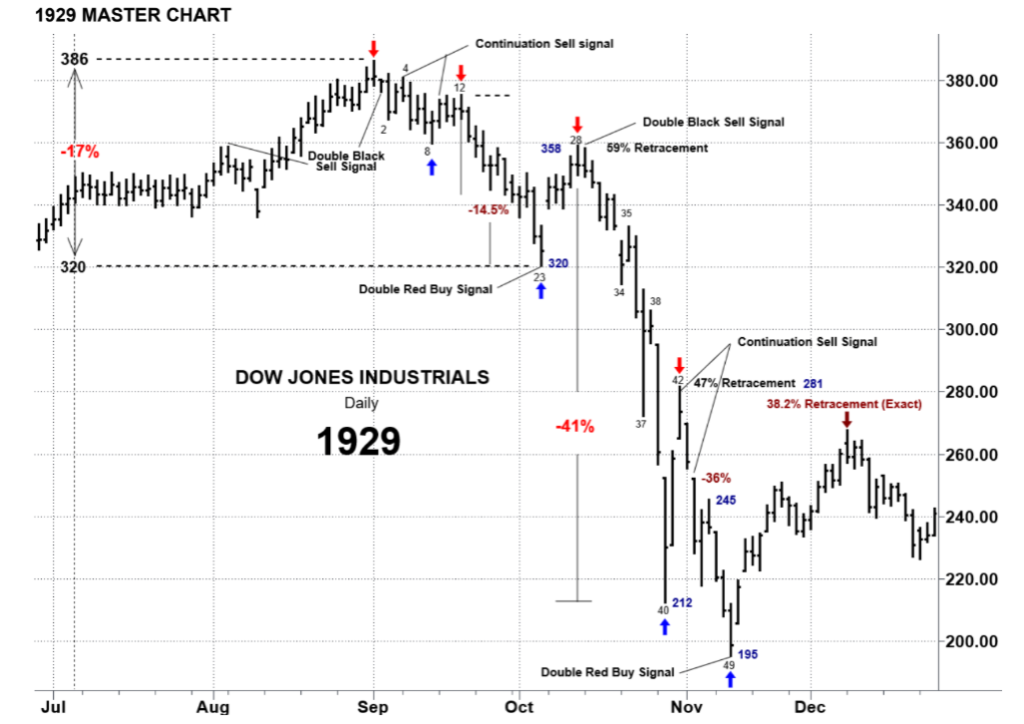
I suspect the vast majority of traders in 1929 thought that the rally off the October 4th low was the beginning of a new up-leg.
When it wasn’t, an historic “false moves lead to fast moves” unfolded.
Last week I flagged the 3 day spike into the top on September 3, 1929.
It was followed by meaningful break.
The market had a one day bounce and then turned down for good.
On Thursday the SPX turned its 3 Day Chart down—a rare occurrence since the April low.
Each instance of the 3 Day Chart turndown since April defined a low with the market resuming its uptrend.
On Friday the SPX once again rallied following a turndown of its 3 Day Chart.
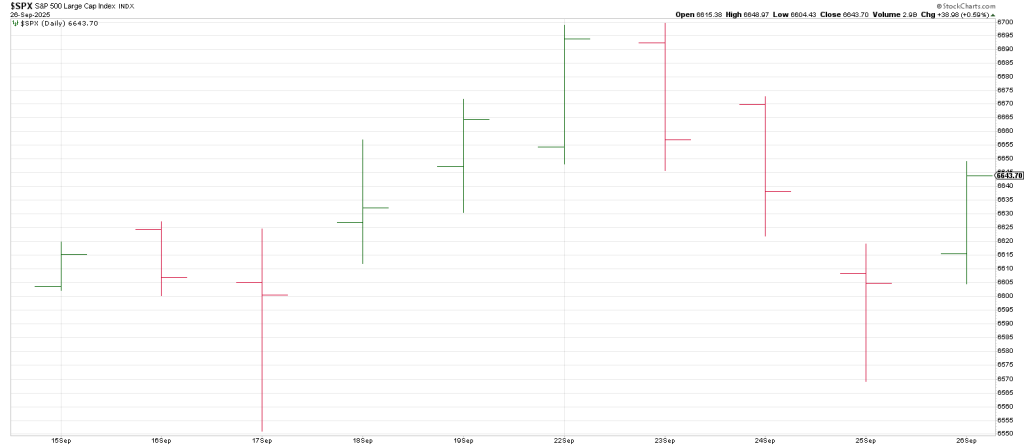
A higher high today above Friday’s high will put the SPX in the Minus One (3 Day Chart pointing down)/Plus Two (2 consecutive higher daily highs) sell position.
Of course if the market is topping (in some degree) it may only give a one day turn up of the dailies—as was the case in 1929 before turning down for the count.
Interestingly, notice that from the October 4 pivot low in 1929, a rally played out the high of which satisfied a Minus One/Plus Two sell setup.
That’s all she wrote before the bottom fell out.
The market talks to us if we have the ears to listen.
In sum, I am not saying this same pattern from early September 1929 is on the table.
I am saying that because of the Time/Price synergy the behavior early this week will be critical to observe.
To recap, we are 96 years from 1929 and 96 squares out with September 22/23.
The SPX struck an all-time high on September 22/23 of 6699.
669 squares September 3, the high in 1929.