“You don’t sound different, I’ve learned the game.’ I’m Looking Through You, The Beatles
At the heart of modern technical analysis lies Dow Theory, a market model born from the writings of Wall Street co-founder Charles H. Dow.
Though often considered an artifact of a bygone era, Dow Theory remains foundational to market analysis in 2025, particularly in moment of market stress, like now.
Dow’s original framework outlined several key principles that continue to underpin technical analysis today:
1) Trends move in waves: the market exhibits three coexisting trends—primary, secondary and minor.
2) Trends persist until reversed: a prevailing trend remains in effect until a definitive reversal is confirmed akin to Newton’s First Law.
3) Confirmation is crucial: for a trend to be trusted, major indexes must confirm each other’s highs and lows.
4) The market discounts all news: price movement reflects the collective interpretation of all know and anticipated developments. Said another way, you “news, you lose”.
These principles still apply today, even as the market’s structure has evolved and Algomatics and ETF’s have become the lion’s share of trading volume.
Confirmation, Divergence, and the Current Market are the 3 legs of traditional technical analysis.
Dow Theory’s emphasis on confirmation—between indexes and between price and internal breadth—emains critically relevant.
IN EVERY MAJOR MARKET TOP OVER THE PAST CENTURY FROM 1929 TO 2022, KEY DIVERGENCES PRECEDED THE DECLINE.
That warning has been flashing in 2025.The SPX reached new highs earlier this year. However, those highs were not confirmed by either the Dow Jones Transportation Average or equity market breadth.
The NYSE advance/decline line , A/D Line, particularly when limited to common stocks has failed to rise in tandem with price, echoing historical non-confirmations seen ahead of the 2000 tech bubble collapse, the 2008 financial crisis, the February 2020 Covid Crash and the early 2022 peak.
For example of recent divergences.
Dow Theory purists would regard this divergence between the major indexes as a bear market non-confirmation—a clear warning of an impending trend reversal not just of the 2022-2025 advance from the SPX 3491 low of Oct 13, 2022, but of the secular bull market from the 666 SPX low on March 6, 2009.
The DJ Transportation Average’s failure to confirm highs in 2025 replicates the Dow Theory signal seen before the crashes of 1929, 2000, 2008, and 2020.
How many retail traders have only started trading since after the 2009 low or even the 2022 low.
I believe the vast majority of traders today have never been thru a true bear cycle.
What they know is the market always comes back.
My realtor is a smart guy. He deals with $50 million dollar properties.
He tells me he’s in stocks but he doesn’t understand the market.
I say, “How can you be in stocks then. How do you know when to exit?”
His answer: “When it goes down I just buy more.,,, because it always comes back.
While some analysts view the Dow Theory as outdated, its core logic remains relevant in tools like the NYSE advance/decline line. These breadth measures have become central to modern technical analysis, offering critical insight into the strength—or fragility—of a move.
When market indexes rally while breadth weakends, it suggest that only a narrowing group of stocks are supporting the gains—a classic late-stage bull market dynamic. Currently that’s precisely what the data shows.
Common stock only A/D lines have been rolling over even as indexes push upward, signaling risk and confirming, at least in theory, that February 19th marked a significant peak and that we are in a Secondary Rally, a test of that peak.
Just over a week ago a host of internal indicators had confirmed short-term bullish momentum:
The NYSE Advance/Decline Line had broken out.
The SPX, NAZ and RUT all staged upside breakouts.
The DJIA reaffirmed its strength with support from cyclical stocks.
Market internals showed a sharp rise in stocks above their 50 and 200 day moving averages.
The NYSE and NAZ McClellan Oscillators and Summation Indexes were all climbing.
That burst of strength faded last week.
Although the Momentum Mohicans continue to rally.
For example:
CRCL
NET
STRL
ASTS
CRDO
MRVL
To mention a few.
As of Friday, June 13, 2025, all of those previously bullish signals have turned downward.
Momentum is no longer expanding. Breadth has deteriorated.
The NYSE recorded 1656 net declines last Friday, while the NAZ posted a highly significant 2853 net declines,
As always Opening Range Breakouts are a good way to capture these bursts of strength on stilts.
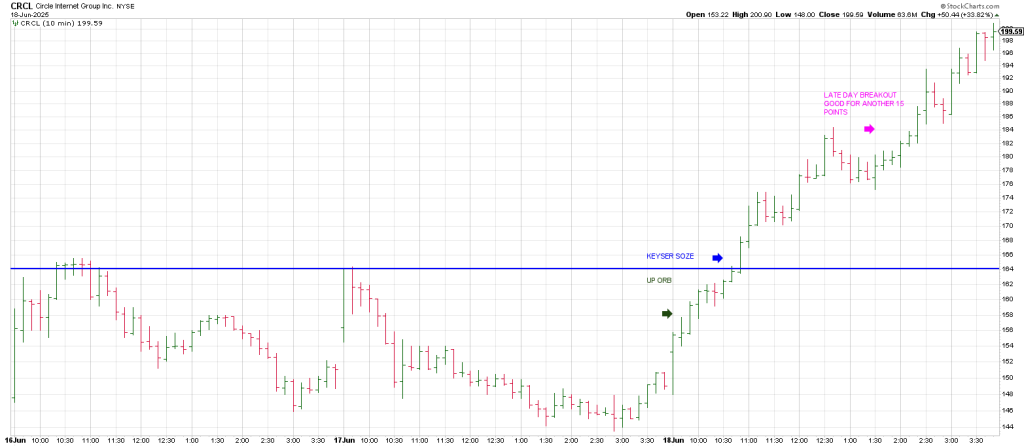
Let’s look at the ORB in CRCL on Wednesday.
CRCL triggered an up ORB on Wednesday at 159,76
When it cleared the reversal bar from Tuesday at 164.42 it triggered a continuation buy signal, a Keyser Soze and exploded.
In sum, history shows that major market turns are rarely abrupt without warning. They ‘frog-boil’ us.
The signs often build slowly through divergences, faltering breadth and the breakdown of confirmation.
In 2025 those signs are once again accumulating.
My view is that the market will make a major top in 2025 if it has not already done so.
1) 49 Gann months from the late 2021 top is December 2025.
2) 18 years is a major cycle. The cycle of the North Node. 18 years from the major October 2007 top is October 2025.
W.D. Gann pointed to this cycle of the North Node of the Moon with two clues.
Look at the subtitle to his coded novel The Tunnel Thru The Air: It is “Or Looking Back From 19 40.
On the Square of 9 Wheel, looking back from the two numbers 19 and 40 is the number 69.
69 is the symbol for Cancer, rule by the Moon.
The protagonist in the novel was born on 6/9.
On page 69 of the novel, Gann explains how to tell the future.
3) A secular bull market top occurred in December/January 1966.
60 years is Gann’s Master Cycle.
As walked thru in several reports this month the week of the Summer Solstice, this week, offers a strong likelihood for a turning point…in league with the first week of July
Which is 90 days/degrees from the major April 7 low.
With Monday’s surge, this week had the best chance for the SPX to push to a new ATH.
However, quickly, the SPX is now in a position to turn its 3 Day Chart back down.
It has two consecutive lower daily lows.
With the futes down overnight, there is a strong likelihood the 3 Day Chart turns down today.
This will be a good test for the market.
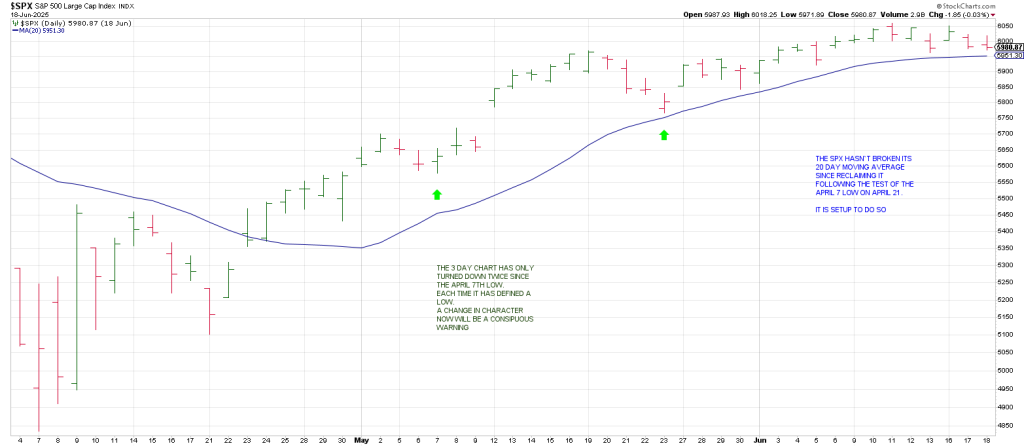
The SPX last turned its 3 Day Chart down on May 23 on a test of its 20 day moving average.
That was only the second time since the April 7 low was tested on April 21 that the 3 Day Chart has turned down.
A turndown in the 3 Day Chart now that does not define a low soon in terms of time and price is sounding a siren…. particularly if the index breaks its 20 day ma and holds below it.
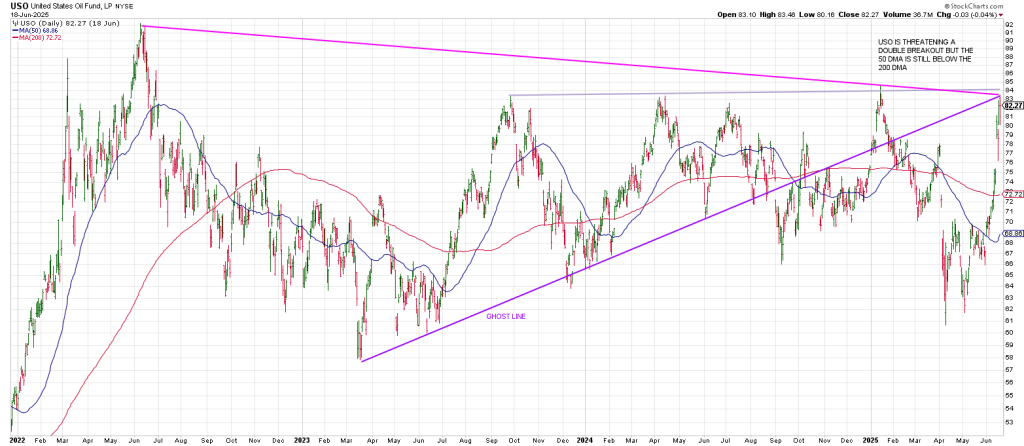
USO is on the cusp of a multiple breakout
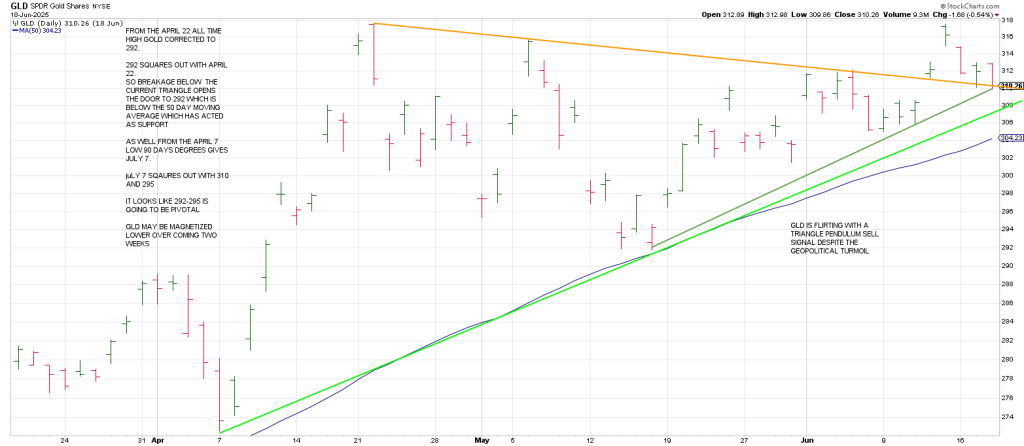
Last week we show the potential for a Triangle Pendulum sell signal on GLD.
GLD is threatening that sell signal Thursday night.
How could gold be making a top of some degree here with all the turmoil around us?
How did gold make a multi-year top in 2011 with QE being unleashed?