“I know I’ll often stop and think about them
In my life I love you more.” In My Life, The Beatles
“Whenever you get a wild excess on the upside, the following correction doesn’t just go back to normal; it almost always falls way below normal.” John Templeton
“The difficulty of determining what any stock is really worth is very great indeed. No two security analyst will agree on the worth of a stock, or even on the definition of the word.”
John Templeton
Legendary investor Seth Klarman stated, “The market tells you when to buy things. And when things are really cheap, on a Graham and Dodd valuation basis, you should like them more. And when they’re really expensive, you should like them less.”
But in reality,, the higher stocks go people love them more.
And, the longer higher prices persist, the more that people are complacent about excess…and risk. They love them more.
It’s not a conflict that traders need to wrestle with because they are short-term opportunists…whether that means day-trading or swing trading, they key off technical versus narratives.
Near the end of the cycle assets do not reflect cash flow or value or any fundamental, but are purely dependent on what a future buyer will pay—on all time frames.
That is what separates investing from rank speculation.
There’s nothing wrong with rank speculation, as long as you stay in your lane and don’t get tempted to change horses in mid-stream…becoming a longer term player because you sold out and the stock is much higher now.
The horse I’m referring to of course is one’s time duration.
At the end of the cycle short-term traders are enticed to become intermediate term traders and intermediate term traders are induced by Mr. Market to become long-term traders.
They know the lessons history, but love the action more.
So what happens is that market participants become inurned to volatility by necessity to ride the momentum bucking broncos.
They feel they need to widen their parameters and move the goal posts because they are pissed at getting thrown off the bucking bull at the rodeo.
This is due to increased volatility at the end of the cycle.
If you want to ride the momentum darlings you have to give short-shrift to your stops—at exactly the wrong time.
But they love them more.
Below are annotated daily charts of some of the current little darlings: the last of the Momentum Mohicans.
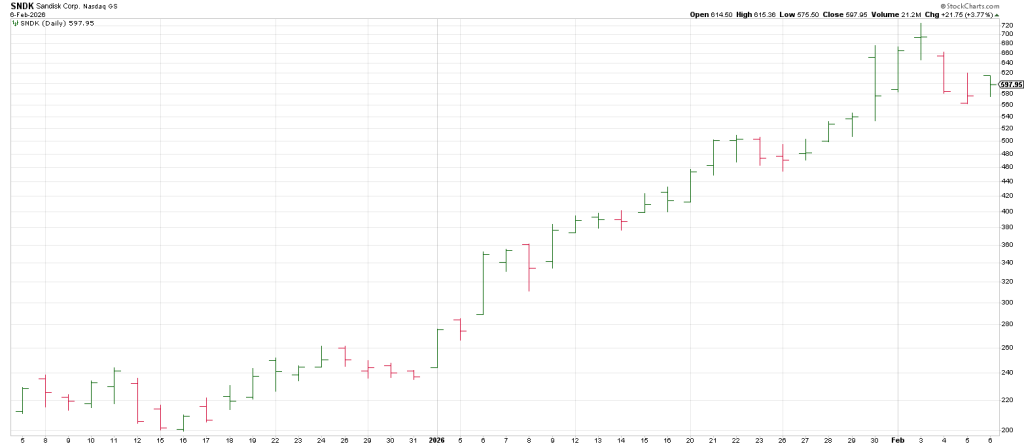
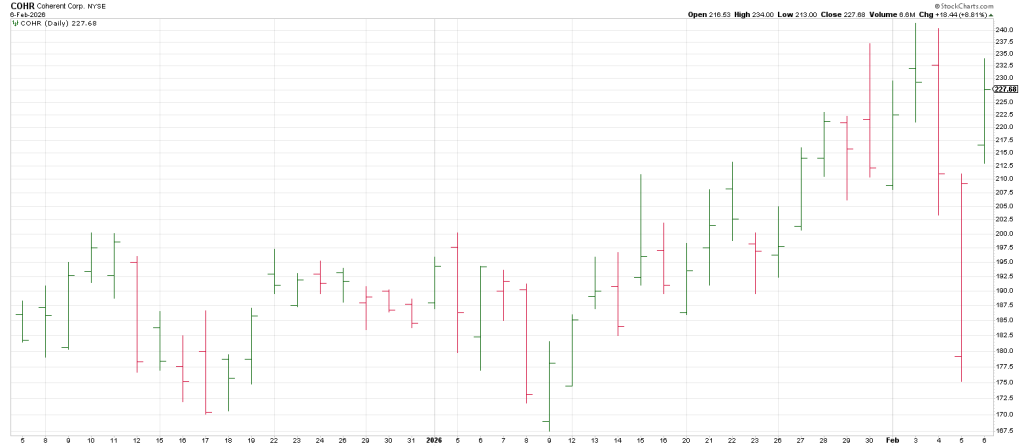
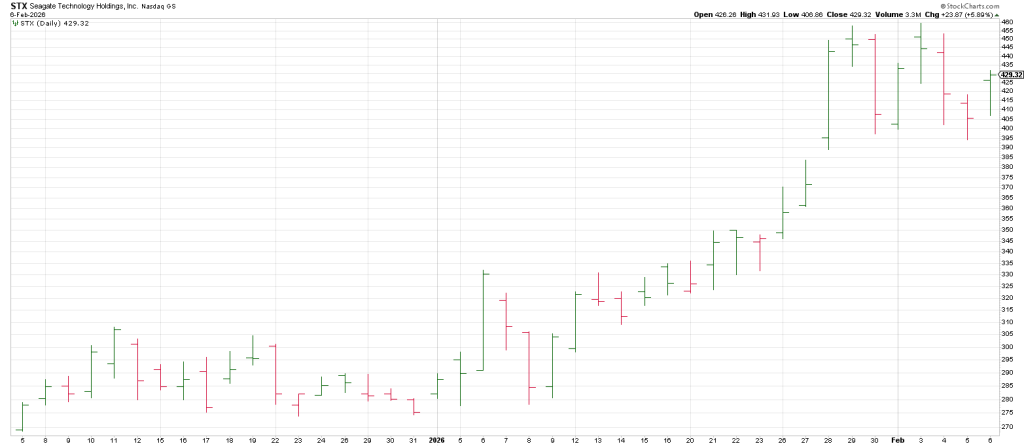
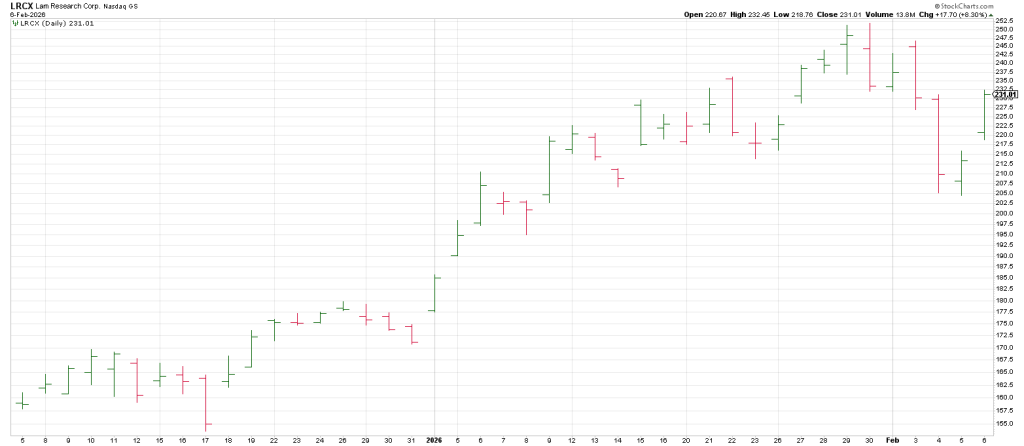
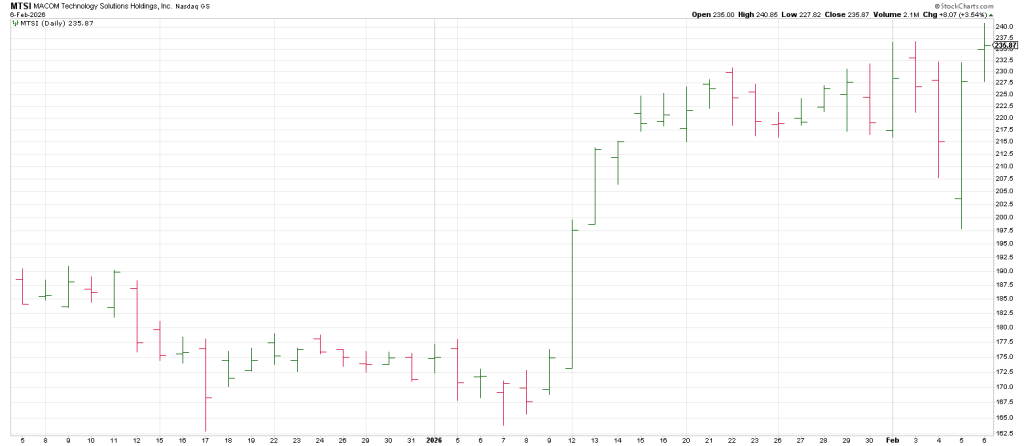
To show a few.
At the end of the day, I key off patterns of accumulation and distribution.
Patterns repeat because that is the way the human brain is wired. It craves the predictable and re-enacting, the same way patterns repeat in nature, because they like humans they are governed by physical law.
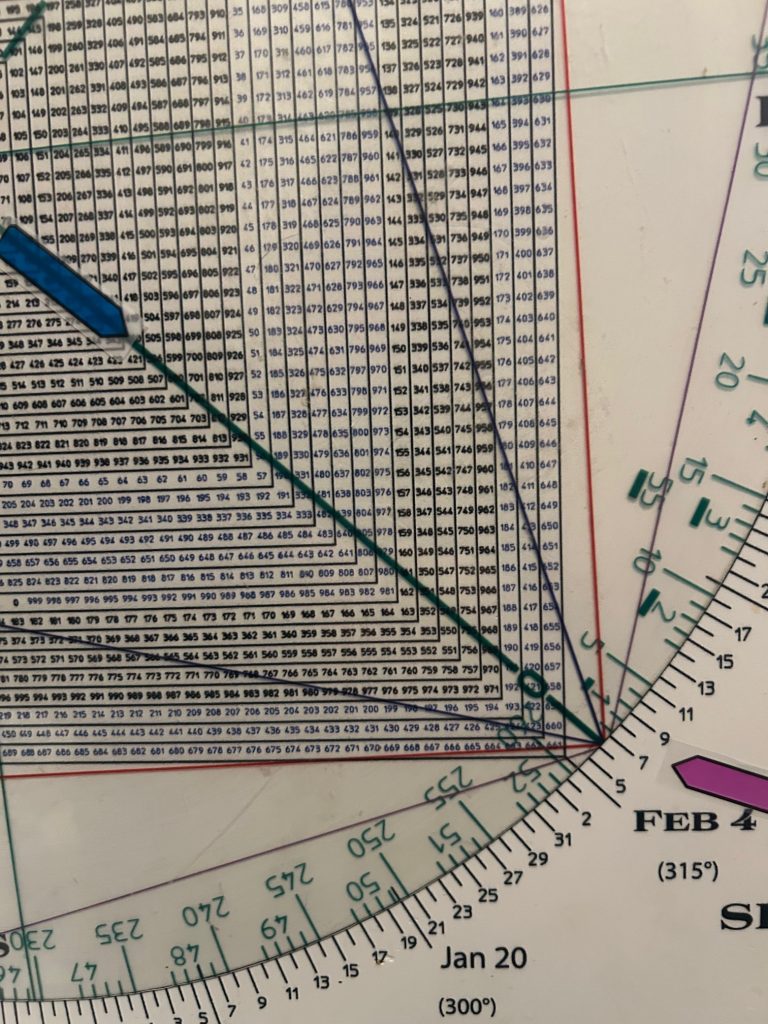
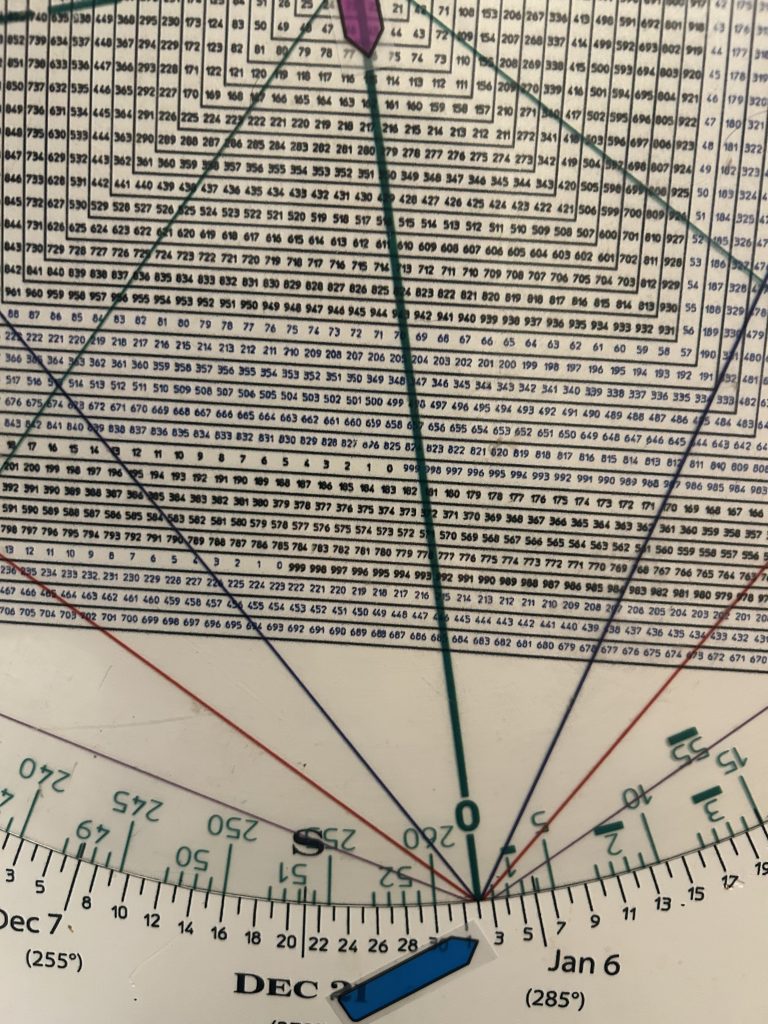
I have been doing this for 40 years and pattern recognition is trumps everything—everything except Time/Price square-outs as defined by the Square of 9 Calculator.
The old saw is that markets never lie…except at the very top and bottom.
Of course every top looks like THE top and every bottom has the promise of THE bottom.
A stocks “word” is often accepted as law, sometimes to the point where price becomes the determining value…versus the other way around.
Was the price of ORCL lying in September, or is it lying now?
Was the price of SLV lying during the run for the roses into late January, or is it lying now?
Was the price of Bitcoin lying at 128,000 when we said it had a date with ‘Hiroshima’ or is it lying now?
Was the price of AVAV lying at the September lows, or the October 10 high?
Or the mid-December low?
Or the mid-January high?
As my dad, the best tape reader I’ve ever met, like to say, “Stocks don’t move, they are moved.”
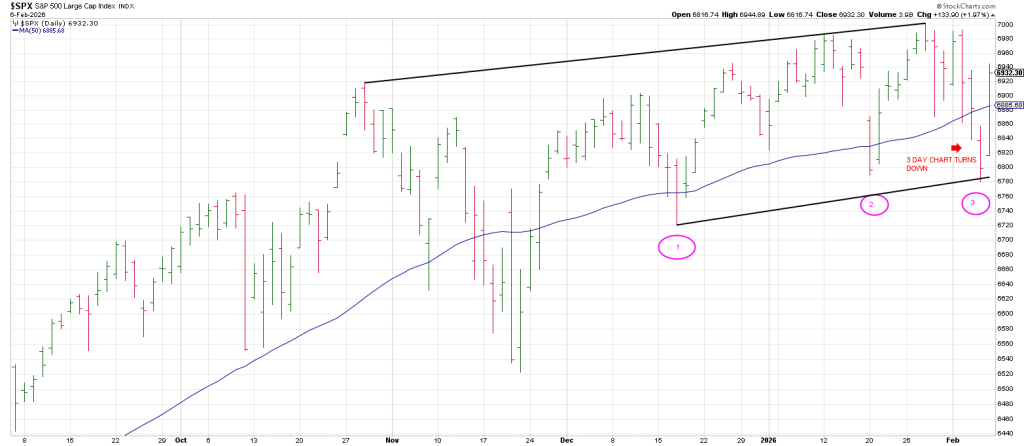
Which brings us to Friday. After turning the key 3 Day Chart down on Thursday the SPX exploded on Friday’s option expiration.
Was the market a coiled spring with crowded shorts in software and crypto last week setting a Trap Door for bears and bulls alike?
Was it a another case of OpEx Pinball with the SPY driving from Thursday’s 675 low to the 690 strike on Friday?
The Option Tail Wags the Stock Dog. And sentiment here remains fragile on a tight leash. That is why I say is may have been a one day wonder.
There was no catalyst that anyone can point for the futes being solidly red overnight to closing up 130 points.
Be that as it may, the picture perfect break of the SPX Bottoms like from December opened the door to a free fall, but Thelma and Louise caught air Friday.
Of course, the last words uttered by Thelma to Louise were, “You think this time is different?”
Our Roadmap from Thursday projected a rally that would setup a short late Friday for this week.
Upside follow through is key, if there is none, the Roadmap is likely correct.
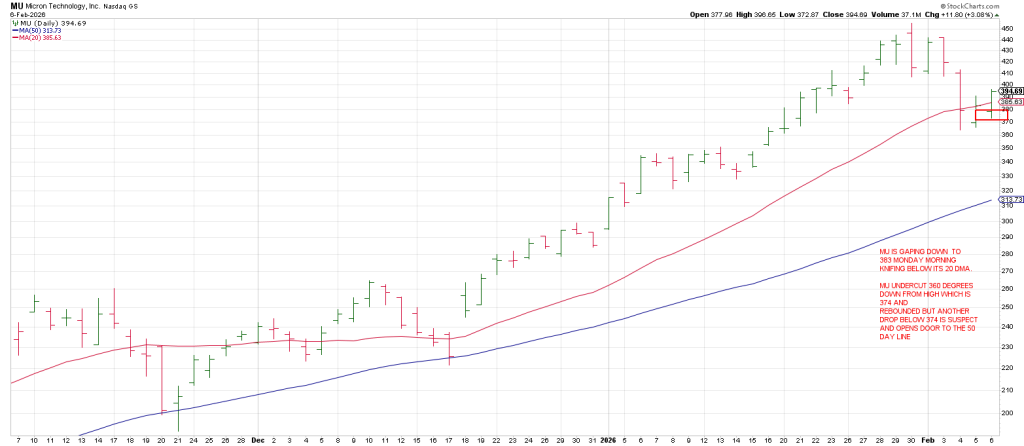
The big tell here may be MU.
It left a large range Gilligan sell signal on January 30 and followed through to its 20 day moving average on Wednesday where it is trying to make a stand.
This morning it is gapping below its 20 dma with authority.
Turn the chart upside down…you’d be a buyer.
Further rally puts the SPX in the Minus One/Plus Two sell position.
This is because the 3 Day Chart is now pointing down for a Minus One and trade above Friday’s high produces two consecutive higher daily highs for the Plus Two part my Swing Method.
However upside follow through with momentum that sticks opens the door to the possibility of a sharp rally at least to new all time highs.
Why?
Since the September 21 low following breakage below the 50 day moving average, the SPX has had three one day Undercut and Rally sequences below the 50 day line.
Each Undercut produced an immediate rally to new all time highs.
Moreover, the SPX pattern is in the spirit of 3 higher lows since the November 21st low (Thursday’s low was nominally lower that the January 20 low.
The point is that 3 higher lows often times leads to fast moves (and vice versa).
In sum should get a strong rally from here there is a strong likelihood the next turning point is February 20/21 which is 90 days/degrees from the November 20/21 low.
A reversal back below Thursday’s low or continuation into February 20/21 sets up the potential for a flash crash.
Conclusion. A survey of stock market professionals in January 1973 concluded with a headline in Barron’s “Not A Bear Among Them.”
A false breakout on January 11, 1973 marked a peak that saw the DJIA get cut in half in the next two years.
I can’t help but wonder if the breakout above the psychological 1000 round level of 1000 in 1973 mirrors Friday’s breakout above the psychological 50,000 round level.
Checking the Square of 9 Wheel shows that February 6 vibrates of the 50,070 region.
(Moving the decimal point to work with the Square of 9 we use 500 for 50,000).
Market participants were also in love at the DJIA breakout in January 2000 to 11,500 region.
115/116 (11,500-11,600 squares out with early January.
This year ALL of the strategists at major institutions interviewed by Bloomberg at the end of 2025 expect stocks to rally in 2026.
They love them all.
The big picture hasn’t changed.
The SPX has Pinocchio’d a Tops Line from 1929 show in this space last fall.
A weekly SPX below shows a loss of momentum since its October 1929 “anniversary high” which kissed the top of the blue trend channel.
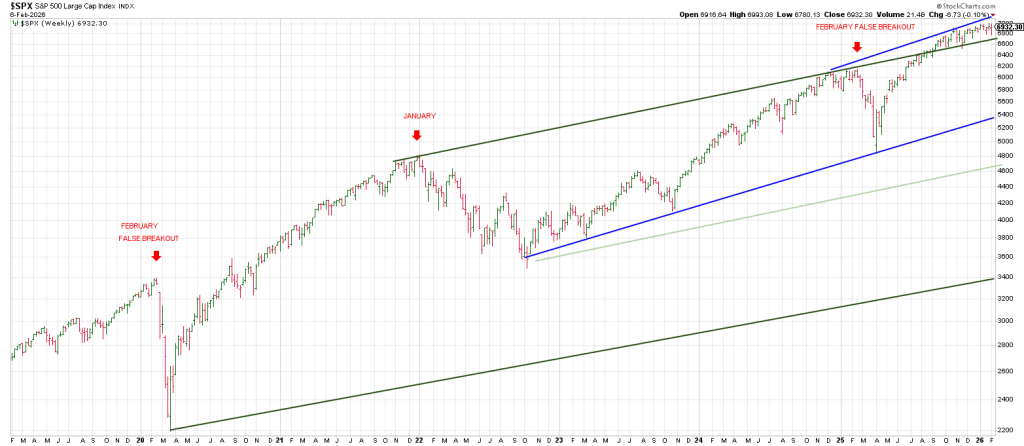
Since breaking out over the top rail of the 5 year trend channel in September it pulled back to test it once in November.
Breakout over the top of the blue channel could ignite another rally phase.
Breakage below the top of the green channel indicates a major top and opens the door to a significant decline to the 5400 region—especially if the prior highs at 6100 from this time last year fail to act as support.
Bottom line if we get a rally to new all time my expectation is for a 7 to 10 % correction.
If the SPX falls below Thursday’s low first the 7 to 10% correction will be on.

Square of 9 Wheel
Purchase your own Square of 9 Wheel. Shipping to US only. Contact Jeff for shipping outside the US.