“He was never know to make a foolish move.” John Wesley Harding, Bob Dylan
Sunday was December 21 a day/week I’ve been talking about for some time.
Why?
Simply put, the universe is synchronous.
A giant resonance machine. Everything is coordinated and in harmony with everything else.
We are just part of it.
We have planets moving in harmony with one another and planets making aspects with each other and that in turn puts a gravitational torque on the sun causing the sun to emit increased amounts of solar radiation.
As the human body absorbs some of this radiation, our cellular biochemistry changes.
Our sugar levels, our protein levels, our amino acid levels respond.
In other words our emotions change.
Emotions are what drive the market—not funnymentals.
Emotions make the ups and downs.
We’ve all seen stocks get hammered with a great earnings report and vice versa, explode on an ugly report.
I think we’re at a point where relatively soon we’re going to see a big emotional change in crude oil.
Now the Sun spins on its axis and every 27 days shows us the same face.
Interestingly this ties to the Moon cycle of 28 days.
This is why the subtitle of Gann’s coded novel The Tunnel Thru The Air is Or Looking Back From 1940.
On the Square of 9 Wheel the numbers 19 and 40 align and point to March 21, the natural beginning of the year as the Sun is at zero degrees Aries, the first sign of the zodiac.
This is why Gann calls March 21 his Zero Point.
The next number after 19 and 40 is the number 69.
69 is the symbol for Cancer…the only sign ruled by the Moon.
So Gann has inextricably linked the Sun and the Moon.
He’s talking about Time and cycles.
Notably when the number 69 is “connected” it becomes an 8. The symbol for infinity.
Further on page 69 in Tunnel, Gann talks about how to tell the future.
Suffice to say that Nicola Tesla also thought the secret to the universe was 3 6 9.
I digress. The 27 day spin of the Sun is not quite the same rhythm as a lunar cycle, but often times coincides with a shift in market MOOD.
The Sun’s “face” turned its face toward us the first week of December—essentially when the QQQ made what looks like a Secondary High. It coincided with a mammoth display of sunspots—larger than the one in May 2024 which coincided with an air pocket pulling back the rubber band before exploding into July 2024.
The size and number of sunspots can never be predicted and is a constant source of wonder.
What we do know is that when the number of sunspots reaches maximum, stock markets soar.
In contrast (and most recently in 2020), when minimum of the cycle is reached prices fall.
Of course, you want to know where we are in the cycle: this was expected in July 2025 but may have been reached in August 2024 when over 380 were recorded in one day.
We don’t know exactly when minimum will be reached, but a decline in number seems to have begun and minim could be reached as early as 2029—just in time for the 100 year anniversary of 1929.
That’s slightly different to another stock market rhythm: for over a century, US stock prices have come to a low as the lunar node moved through Aquarius: suggesting decline at least in the markets from July 2026.
The important thing to remember is that no single cycle can be considered on its own.
No forecast should be made until there are several clues to support it.
To recap, I have been pointing to this week —centered on Dec 21— (Gann taught us to key off the weekly bar).
This is because we are 60 months or 5 years from the December 21 Jupiter/Saturn Great Conjunction.
The market has a 5 year rhythm as part of the Decennial Cycle.
Jupiter and Saturn were Gann’s “Time Keepers”.
Everything is enhanced because December 21 is on the Cardinal Axis (North/South).
This scratches the surface.
If you were standing on the Sun on at the December 11th ish Secondary High and looking out across the solar system it would seem that Saturn and Neptune (illusion) were in the same area of the zodiac—and on a degree known as the World Axis.
This is extremely significant. Although these conjoin approximately every 36 years it is nearly three centuries since they have last aligned on this axis in 1738. The years that followed were marked by major international conflicts, significant political shifts in GREAT BRITAIN, and widespread natural disasters.
Where should we look first for war? Venezuela? China? Lebanon? Russia?
It is also noteworthy that change in administration in Russia (or USSR) has coincided with this cycle. These themes could play out again.
As well from mid-December to this week, an earth-centered view finds the Sun, Mercury, Venus and Mars—together with a Last Quarter Moon. History suggests this is when markets take a marked down-turn.
It is an echo of the Harmonic Convergence on August 25, 1987. A major top.
The combined effect of these should see volatility rise and we have certainly seen that from late November.
In sum, it is too easy to find correlation between planetary cycles and war cycles in 2026.
In particular there is a Pluto aspect to Haumea, a dwarf planet, that is a cautionary tale.
It July 2026, Jupiter opposes Pluto and the Pluto-Haumean combination squares-out which likely sees a violent response.
In addition in the summer of 2025, Uranus (politics) makes a full Gemini ingress in late April 2026, but as viewed from the Sun arrives there on January 9th.
What’s interesting is that ties to the fakeout/breakout high on January 11, 1973 from which the market lost 50%.
As well the April time frame is pivot because that is where the market rallied to after the November 13 crash low in 1929.
Uranus last visited Gemini from 1941-1949.
The first 4 years of that cycle found the U.S. in WW 2.
The cosmos doesn’t ‘do’ exact repeats and this time is very different as Uranus joins Sedna, another dwarf planet whose orbit is approximately 11,500 years. The last time that Uranus and Sedna met in Gemini was close to the end of the Little Ice Age when there was significant and rapid rise in global temperatures.
Politicians will be twitterpated.
The market.
The SPX is in the Minus One/Plus Two sell position but looks like it will turn its 3 Day Chart up today.
The subsequent behavior will be key.
If I were to surmise the year ahead it would be with the following daily QQQ.
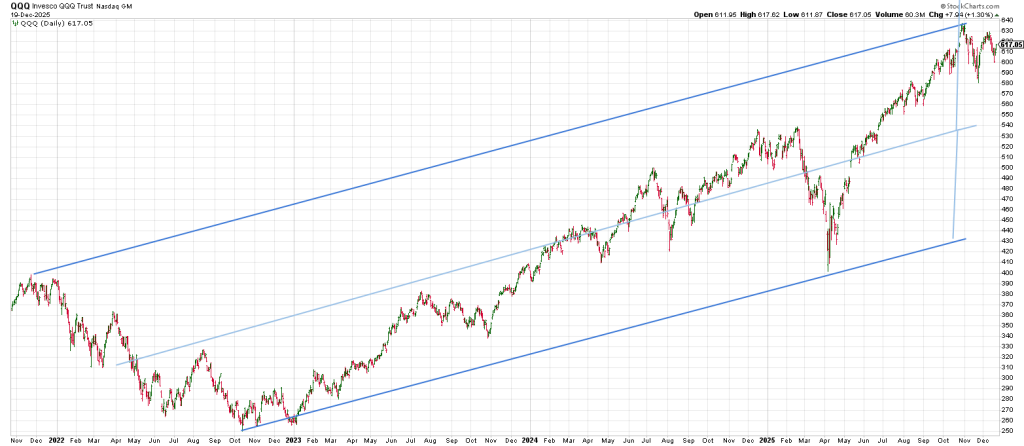
I connected the late 2021 peak and the late October peak in 2025.
I then paralleled a Bottoms Line from the October 2022 low.
Notice how the April 2025 low basically kisses the Bottoms Line.
It looks like the Q’s are working on an A B C correction with the C Wave taking out the last swing low at 580.74.
Breakage below 580 opens the door to the mid-channel line in the 540 region.
While the Q’s have only 1 daily higher high, the action on Friday was in the former glamours.
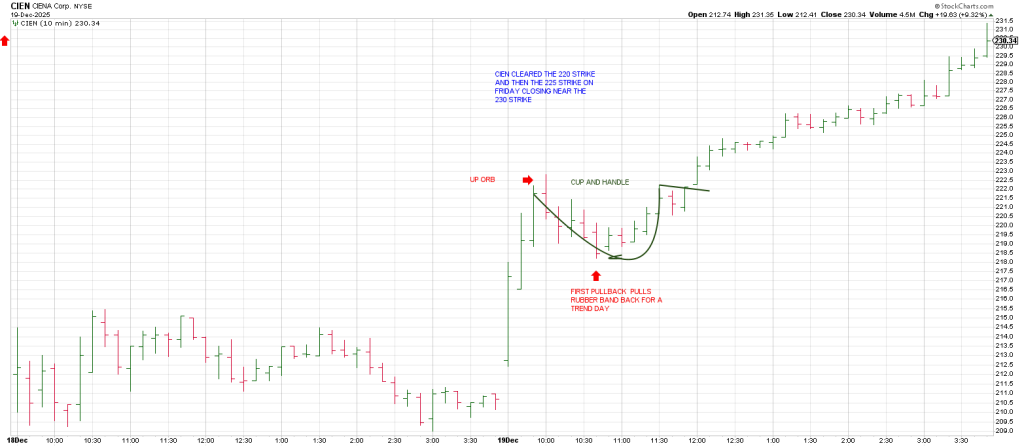
CIEN
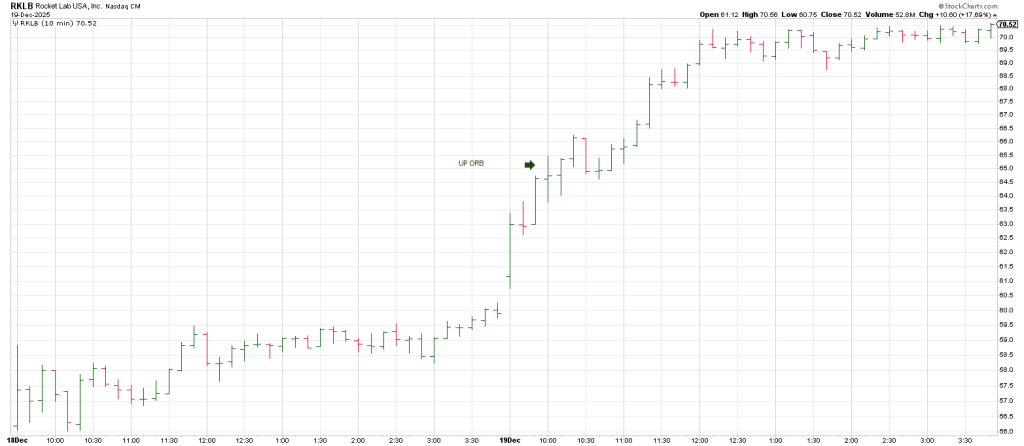
RKLB
COHR
PLTR
To mention a few.
CIEN and RKLB were both long ideas, CIEN an Overnight Swing and we swung RKLB early in the day.
I didn’t fully capitalize on them.
Here’s what I should have done.
Trimmed both but kept a Stub in both.
Why?
The Roadmap was unequivocal about a Trend Day Up.
It was an OpEx.
Stocks were coming off an oversold condition on Wednesday/Thursday.
OpEx and the presumption of a Trend Day on the table perpetuated a Jail Break Rally.
In the future when these “stars align” we will capitalize accordingly.