“Now when I talked to God I knew he’d understand
He said, “Sit by me, and I’ll be your guiding hand”
But don’t ask me what I think of you
I might not give the answer that you want me to.” Oh Well Haim/Fleetwood Mac
“Everything that happens once can never happen again.
But everything that happens twice will surely happen a third time. Paulo Coelho, The Alchemist
“I would now like to propose that instead of ‘causality’ we have ‘relatively constant connection through effect’, and instead of synchronicity we have relatively constant connection gthrough contingency, equivalence, or ‘meaning’.” Carl Jung
The “Comet of the Century” will shine in the northern hemisphere from September 27th and be visible until the last week in October.
I will be visible for the first time in 80,000 years
It will be closest to Earth on October 12, 2024.
The period around October 10-12 is an important anniversary in markets:
- The bear market low in 2022
- A Flash Crash low in 2014
- A major low in 2011 which perpetuated an uninterrupted for 3 years
- A crash low in 2008, a Primary Low, ultimately followed by the Secondary Undercut Low in March 2009
- The major bull market top in 2007
- The major bear market low in 2002
- A crash low in 1998
- A major low in 1992
- A major low in 1990
- the final pivot high prior to the 1987 crash
- after the initial up-thrust from the August 1982 bear market low, the market saw a confirming surge higher in early October 1982
- an interim rally high in 1973 that marked the beginning of the second leg down in the 3-74 bear
- a major crash low in 1966 marking the end of an 8 month slide
- a major secondary low in 1962
- a major low in 1957 that marked the low prior to the beginning of a runaway move into August 1959
- a crash low in 1946
- the final pivot high prior to the 1929 crash. Essentially the Great Crash began from October 11th.
- the pivot low in 1924 that marked the true start of the Roaring 1920’s bull
Is it a coincidence that this comet will appear and be visible just as an all-out war appears about to erupt in the Middle East and a pivotal presidential election?
It is said that Nasrallah, the Hezbollah leader that Israel took out is a descendant of the Islamic prophet Muhammad.
In Genesis 1:14, the Bible tells us that one of the reasons God created the lights in the heavens was because He intended to use then as “signs”.
Jesus warned that there would be “signs in the sun, and in the moon, and in the stars” in the days prior to his return.
The comet is called C/2023 because it was discovered in 2023. This is when Hamas struck Israel.
Rosh Hashanah, the Jewish New Year, begins on October 2nd.
Does the one year anniversary signify a turning point?
The comet will shine the brightest on October 2nd.
As well, there will be a solar eclipse on October 2nd.
So on Rosh Hashanah the Comet of the Century will be the brightest at the exact time of the eclipse.
Quite a coincidence?
Or is it synergistic?
Remember there was the Great American Eclipse on April 8th 2024.
April 8th ties to the major market low on April 14th, 2024,
It roughly squares out with the mid-July peak this year,
The first week of October is opposition the Great American Eclipse of April 8th.
As we flagged last April, a 12 to 13 week run would mirror the last ditch blow off rallies in 1929 and 1987.
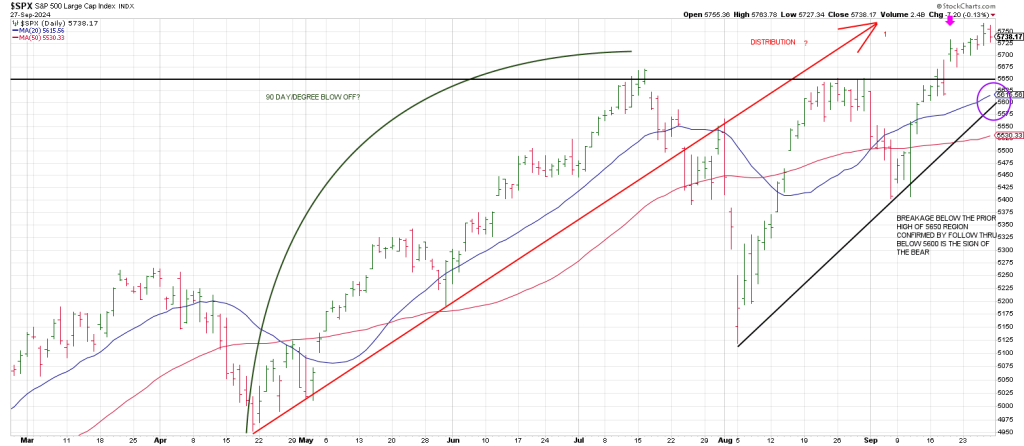
Since the explosion following the Fed Day Reversal on September 19th, momentum has been AWOL. In fact the SPX has traced out 3 narrow-range days out of the last 5 sessions.
If the Fed ‘non-emergency emergency’ cut on September 18th was the catalyst for run for the roses, momentum needs to show up soon.
Alternatively, a roll-over below the 5650 prior highs is a yellow flag.
Downside follow thru below the 50 day moving average coincident with a Bottoms Line from the August 5th Flash Crash low is a red flag.
As the above daily SPX shows a 12 week blow-off pattern from the April low played out striking an important high in mid-July with a Flash Crash into August.
Was that a precursor?
While the SPX and DJIA have gone on to score new record highs in September, the QQQ and IWM have not.
Is it possible the SPX and DJIA are setting Secondary Highs?
Notably, the Covid Crash saw a higher high in February above the January 2020 high prior to the plug being pulled.
As well, the October 11, 2007 high was a false Secondary High above the July 2007 Primary High.
Is it 2007?
That was 17 years ago.
17 is a prominent cycle of 204 months.
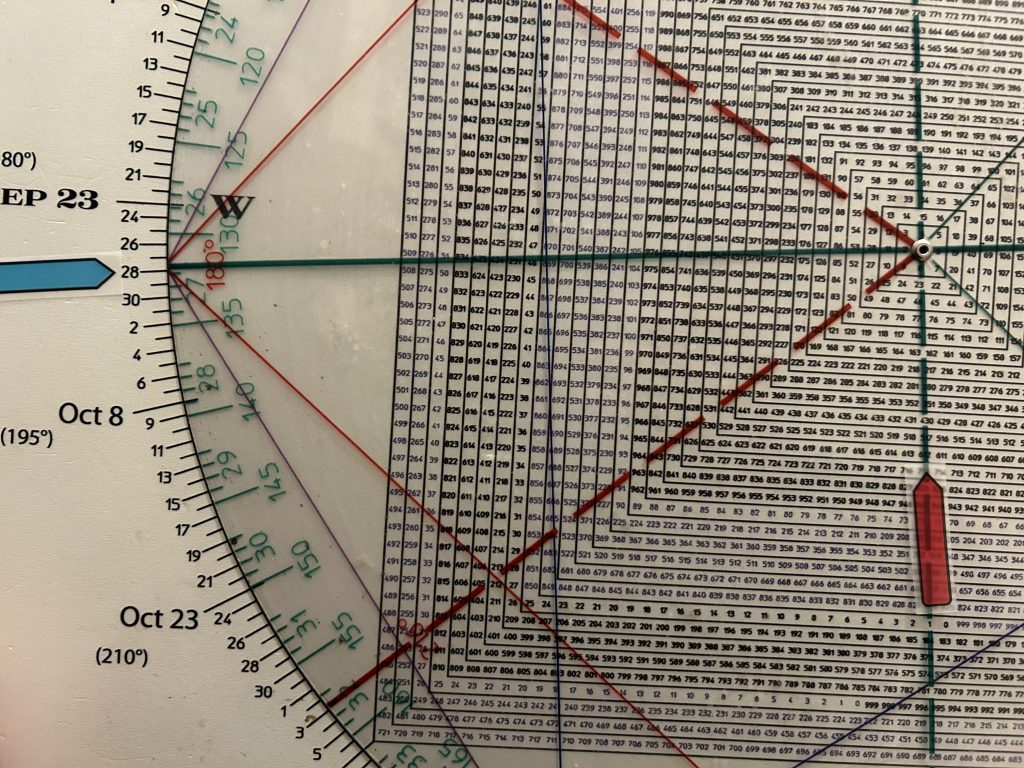
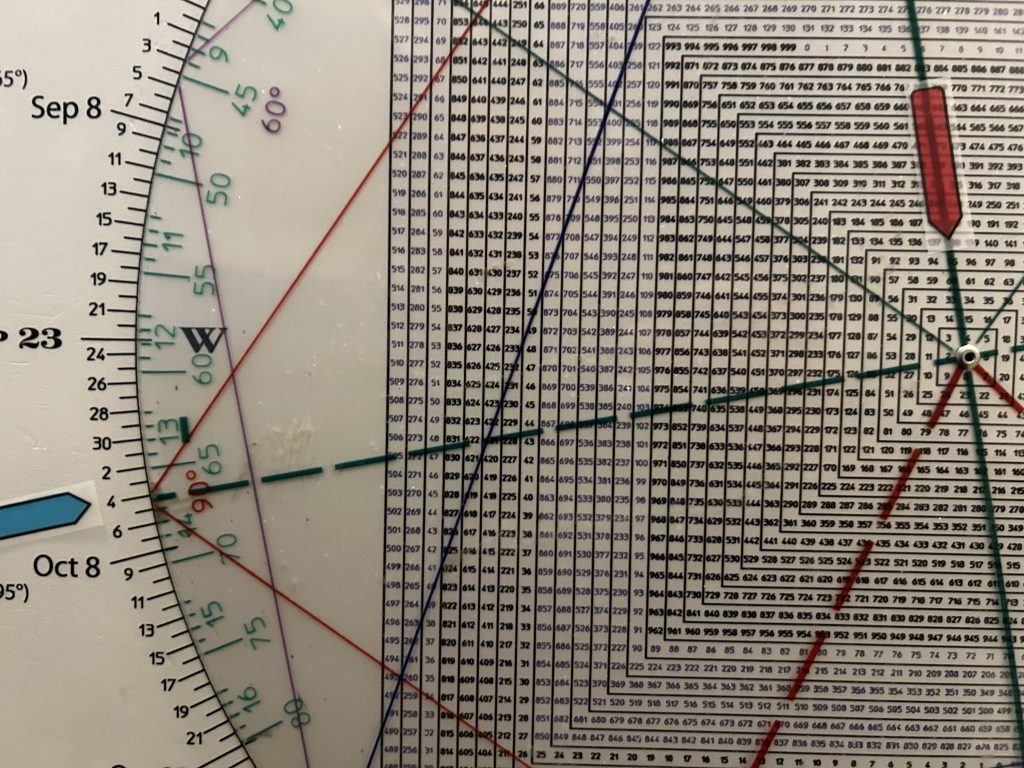
Checking the Square of 9 shows that 204 is on the Cardinal Cross, aligning with the Spring Equinox and the Autumnal Equinox.
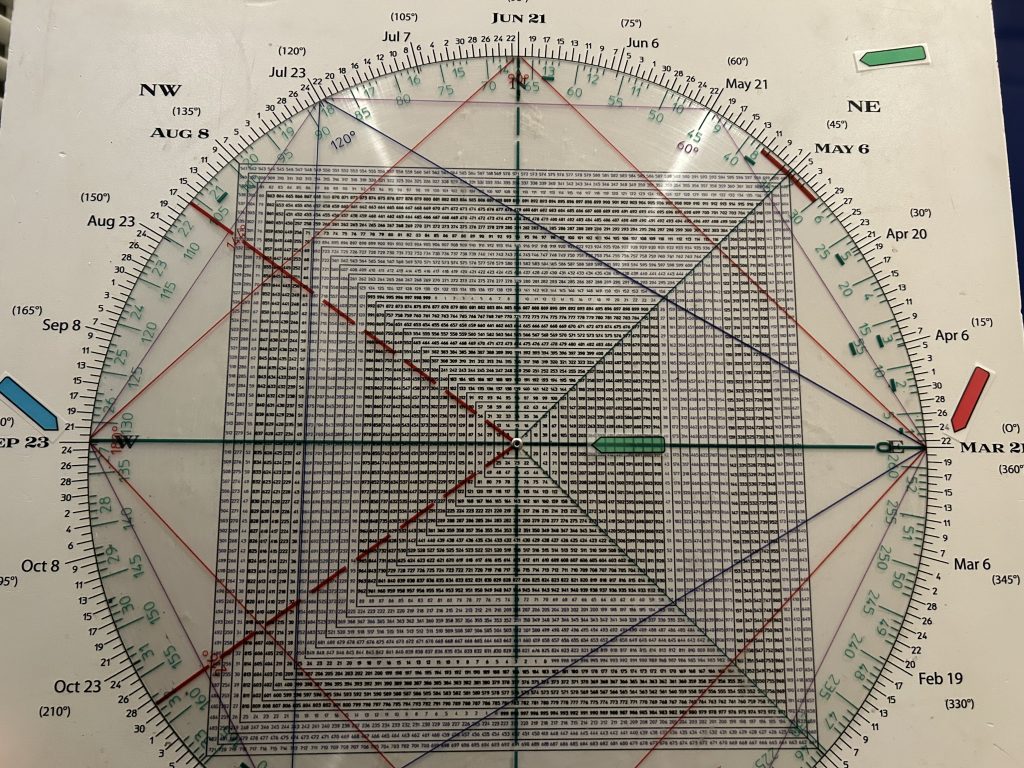
We walked through the significance of the Autumnal Equinox to W.D. Gann in a report last week.
On the week of Sept 22, the Fall Equinox, the SPX struck a record high.
I think a close back below last weeks 5699 low may be a ‘sign’.
If so downside follow thru below the prior weekly highs around 5650 is a blaring siren.
Breakage below the summer highs opens the down door.
On October 9th and 10th, the Comet of the Century will pass almost directly between Earn and the Sun.
It so happens on October 12 when the comet will be closet to Earth that Yom Kippur occurs on that date this year.
This is the anniversary of the Yom Kippur War in 1973.
That was 51 years ago or 612 months.
Remarkably 612 squares-out with October 28th.
Why do I use months. Because moonths reflects the moon cycle.
The most important trend for Gann was the monthly.
Wheels within wheels: the cycle of the moon is 28 days.
The Saturn cycle is 28 years.
The Greek name for Saturn is Chronos, the God of Time.
Saturn is Old Man Time.
This is an important week.
Not a lot of people are looking at the signs.
Maybe something, maybe nothing but as we have been noting all year the days of the year in 2024 are the same as 1929.
1929 was 95 years ago.
On the Square of 9 Wheel, 95 squares out with October 4th, this week.
Coincidence? Perhaps, but it was 58 years from 1929 to 1987.
On the Square of 9 the number 58 squares October 28/29, the date of two Big Kahuna’s in 1929./
Taken together they amounted to a near 25% drop.
In other words if you were trading in 1987 and were as smart as Paul Tudor Jones and thought the pattern from 1929 was playing out, and saw the above relationship from 58 years vibrating off October 28th/29th, you might have said to yourself,
“there is an undeniable Time harmonic between the crash in 1929 and this October.
Ge maybe Tudor has a Sq of 9 Wheel J.
Is the Unthinkable Unthinkable this October?
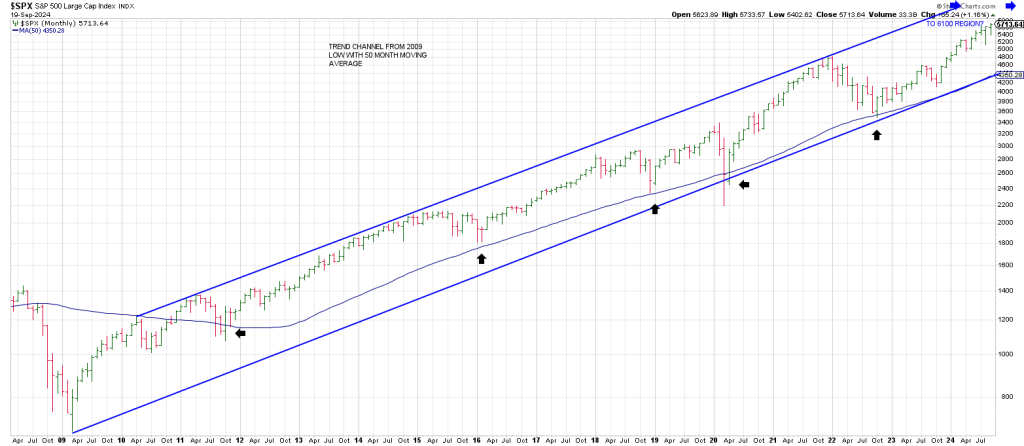
Well a 25% drop from current SPX levels takes the SPX back to around 4300.
This is the high close of the up-thrust in October 2023, the week the rally the runaway rally started.
4300 also ties to the bottom rail of the bull trend channel from the 2009 low.
Interestingly, 55 is the Gann Panic Cycle.
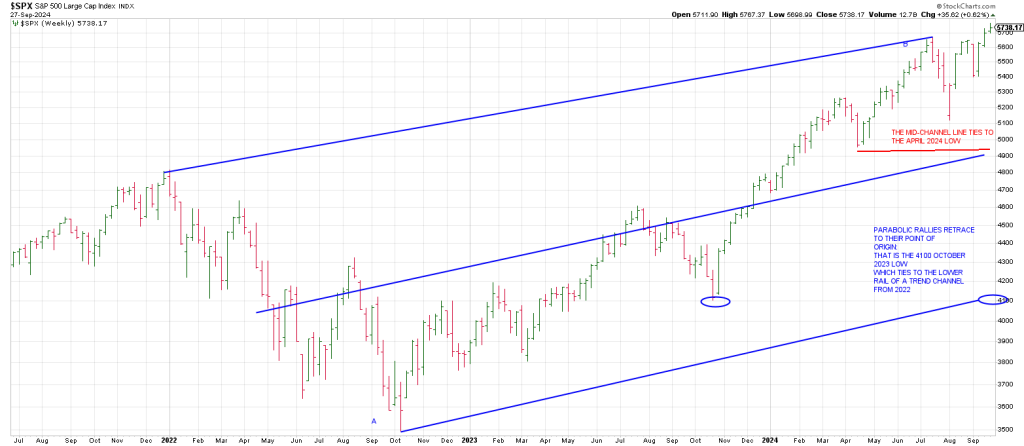
I created a trend line connecting the January 2022 top with the July 2024 high.
I then paralleled a line from the 2022 low.
It “points to” the 4300 region over in October/November.
Notice that the mid-channel line ties to 4900 and the April 2024 low.
Just below 4900 of course is the 4818 January 2022 top.
One can imagine a potential Cascade setup if 4900 is snapped with follow through below 4800.
With the market skating through what is an historically a rough September and scoring record highs,
Will there be a Ketchup Play and a Red October to Remember in 2024?
Interestingly, the DJIA left a Lizard or Shooting Star sell signal on Friday.
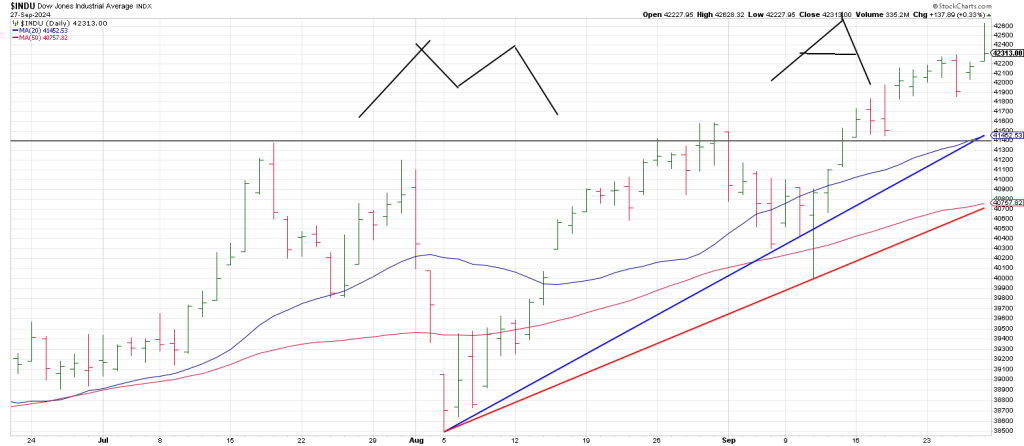
Friday’s reversal may have defined the top of the ‘A’ of a Gann M A Top.
Breakage below the 41,400 region which ties to the 20 day moving average over coming days opens the door to the 50 day moving average.
The significance of both these moving averages is underpinned by Bottoms Lines from the August 5th low…which itself defines a 3 point trend line of support in the 39,200 region in October.
The bull has shrugged off many things that could cause it to slip-up since the August air-pocket
Creating an aura of invincibility, the mother of complacency.
It must be said that crashes don’t come from too much bullishness but from too much complacency.
In sum if the market is not topping in this time and price zone, there is an alternate level on the SPX that we defined a few weeks ago in this space.
Tomorrow’s report will walk through how the probabilities for this potential.
But time is running short. And risk is rising.