“I came across a fallen tree
I felt the branches looking at me” Somewhere Only We Know, Keane
“The only problem with fundamental analysis was that it appeared not to work.” Stephen Leroy, Journal Of Economic Literature, December 1989
The ancients told time by the moon.
Today we tell time by the sun.
W.D. Gann cryptically pointed out the significance of the moon as a factor in his forecasting in many ways.
For example on page 69 of his coded novel The Tunnel Thru The Air (moonbeam?) Gann discusses how to tell the future.
Of course 69 is the symbol for the zodiac sign Cancer, ruled by the Moon.
Gann is pointing to the moon.
But he is also pointing to the ‘relationship’ between the moon and the sun.
I’m not going to get into that here. It’s a deep dive.
Cancer starts on June 22 and is due north (on what is referred to as the Cardinal Cross—due north, south and due east, west) on the Square of 9 Wheel. It is 90 degrees square the zero point of the year March 21st and the Spring Equinox. March 21 is what Gann called the zero point of the year because this is when the Sun is always at zero Aries, the first sign of the zodiac.
This year we had a full moon on Tuesday September 17th. The moon appeared full for 3 days.
In addition on the night of the full moon, there was a partial lunar eclipse.
This entire configuration also ties to the Autumnal Equinox on Sunday, Sept 22.
To recap, an astronomical trifecta— full moon, lunar eclipse, Autumnal Equinox.
On March 20, 2000, the Spring Equinox occurred in tandem with a full moon.
The Great Bear Market of 2000-2002 in which the SPX declined 51% started on March 24th, 2000, when the SPX and NDX both peaked—4 days after the aforesaid full moon/Spring Equinox.
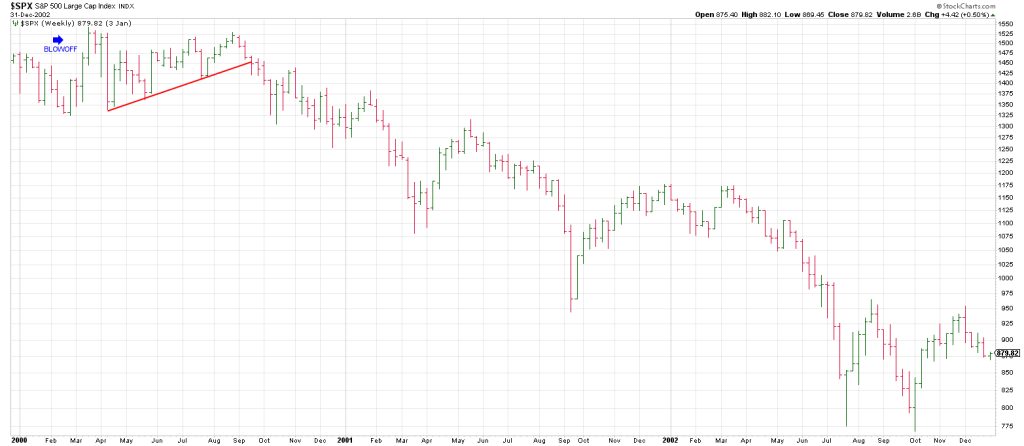
So aspects of astronomical cycles are similar between the current period and March 2000.
Naturally the Fall Equinox is 180 degrees straight across and opposite the Spring Equinox.
Late this week is 4 days after the Fall Equinox IF the market wants to wear a Rolex.
4 days from the full moon last Tuesday night was Saturday.
Have the SPX and DJIA topped after scoring nominal new highs above their summer highs?
Is the current pattern analogous to the Spring of 2000?
That was 24 years and 6 months ago or 294 months.
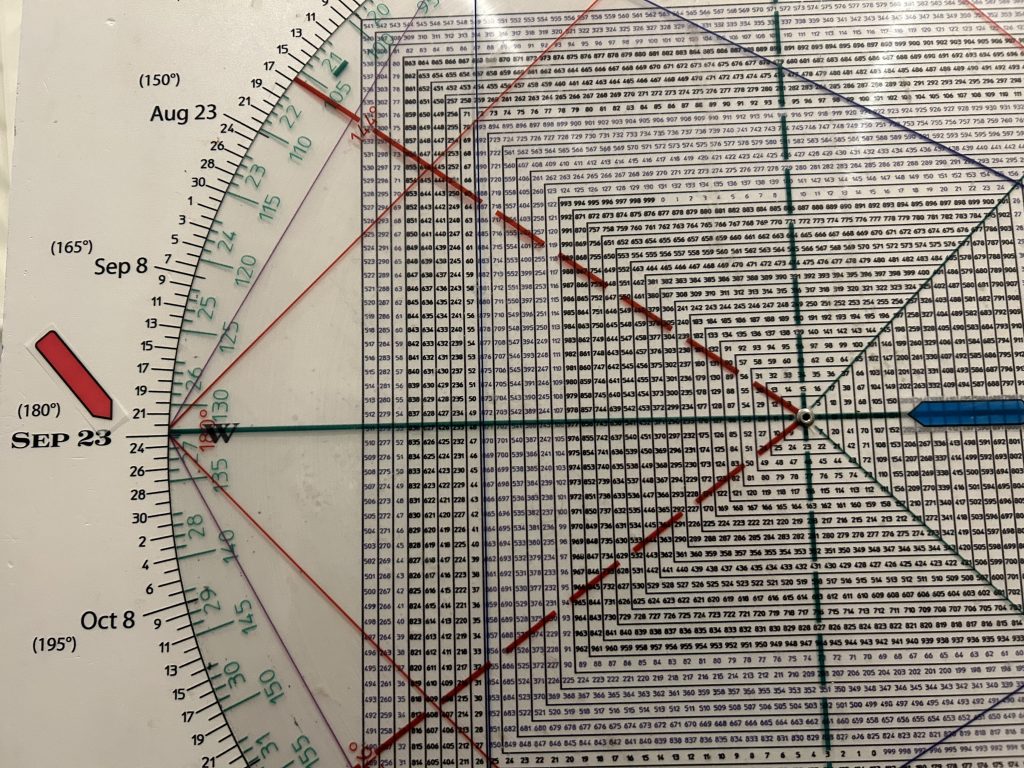
Interestingly. On the Square of 9 Wheel, 294 “points to” mid-October, an extremely historic turning point.
To mention just a few such turns: it was the bull top in 2007, the bear bottom in 2002, the bear low in 2022.
In late March/early April 2000 the DJIA struck a Secondary High, a lower high than its peak in January producing a divergence amongst the leading indices.
Today we have a divergence with the NDX well below its July peak.
Today is the first trading day since the Fall Equinox on Sunday, the day that the fabled W.D. Gann called the day more likely to see a reversal than any other day of the year.
Did anything happen in markets on March 21st, the Spring Equinox, in 2024?
It was the exact high prior to a drop into April 14th. It was what may end of being the first of a
Pattern of 3 Drives to a High: March, July and Sept/October.
I am old enough to recall the October “massacres” of 1978 and 1979, the crash of 1987, the mini-crash of 1989, the 1997 Asian collapse and the Long Term Capital Markets plunges, which started to cascade downward in late September.
As well, while gold bullion topped in January 1980, gold stocks made their highs on September 22 of that year.
Looking back further, on September 22, 1929, the Dow Jones Utility Index became the final major average to make its high before the Great Crash.
The historic Gould-Fisk Gold Corner Panic saw riot conditions as gold peaked exactly on September 21st in 1869.
And, in 1873, a panic forced the New York Stock Exchange to shut down on SEPTEMBER 20th.
This is an important date as the panic triggered the first Great Depression in the U.S. and abroad.
It lasted from 1873 until 1878/9.
The economic downturn became known as the Long Depression after the stock market crash of 1929.
Maybe something, maybe nothing, but that was 151 years ago.
On the Square of 9, the number 151 is 180 degrees straight across and opposite September 23.
Amazing.
Who can forget 2008 when markets when into freefall in the days following the collapse of Lehman Brothers?
What remembered less well now is the market chaos in the subsequent days after the House of Representatives initially rejected legislation that created the Troubled Assed Relief Program.
Appropriately TARP…as in baseball when teams pull tarps out over their fields when it rains to protect the PLAYING SURFACE.
Currencies have seen historic changes around this date as well. The British pound was taken off the gold standard and was devalued a huge 28% on Sept. 21, 1931.
54 years later the Group of Five produced the Plaza Accord which produced a sharp decline in the dollar and expansion of global liquidity.
Black Wednesday, when Britain was forced to withdraw from the European Exchange Rate Mechanism , came a few days early on Sept. 16, 1992.
Treasury notes and bond yields made their historic highs in late September 1981 with shorter maturities hitting 17% and long bonds reaching 15%. That marked the end of a 35 year bear bond market from the end of World War 2.
Coincidences?
The Dept. of Neuranatomy at Yale Medical School, discovered that the human nervous system typically undergoes measurable perturbations during the late September time period (and in mid-March).
In sum, this week sets up a potentially historic turning point.
In tandem with these natural cycles the SPX struck 5730 last week,
This is of interest because 573 vectors 481, the top in January 2022.
To recap what we discussed last week, if the SPX sees momentum thru 5730 it theoretically opens the door to the 6100 region.
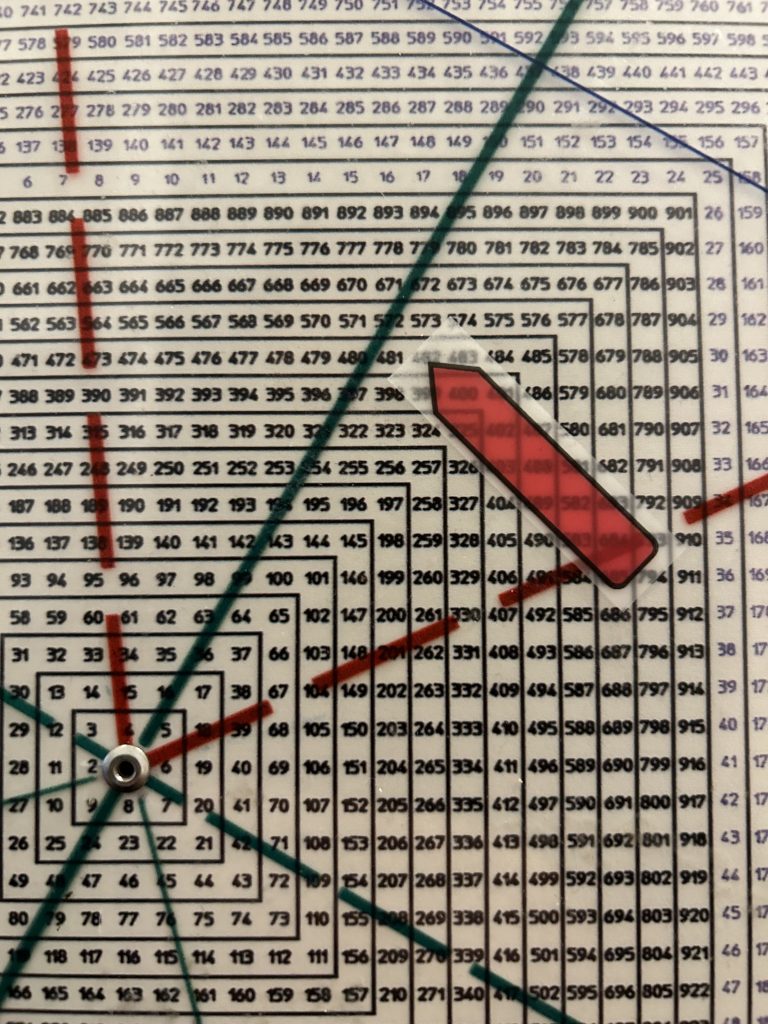
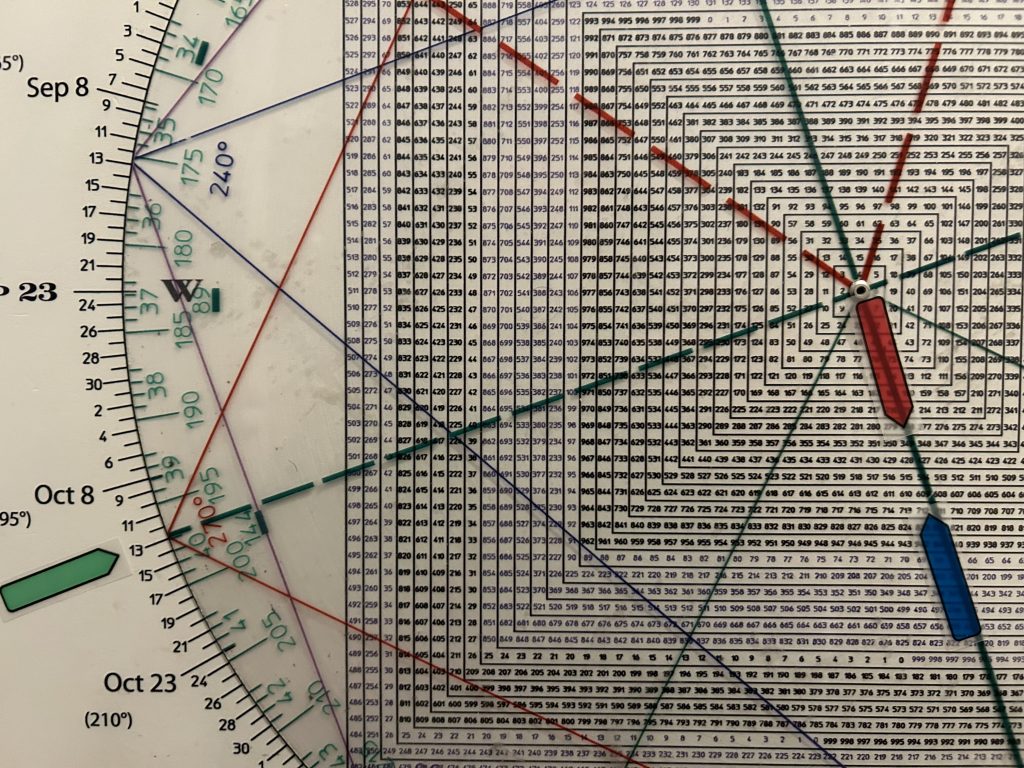
This is based on the horizontal price octave chart showed last week seen below again.
610 (6100) is 3 full revs of 360 degrees above 349 (3490), the October 13th, 2022 low.
Just as October 13 was a Time/Price square-out with 349 squaring October 13th, so too does 610 square October 13th.
Is it possible the SPX could drive to 6100 in a few weeks?
If so it would mirror the two weeks into the March 24th, 2000 Bubble Top
That said Time is more important than price. Only momentum past this week points to a blow off to 6100 region.
Consequently, breakage below the July/August tops of 5670/5650 respectively, that sticks this week is a cautionary tale.
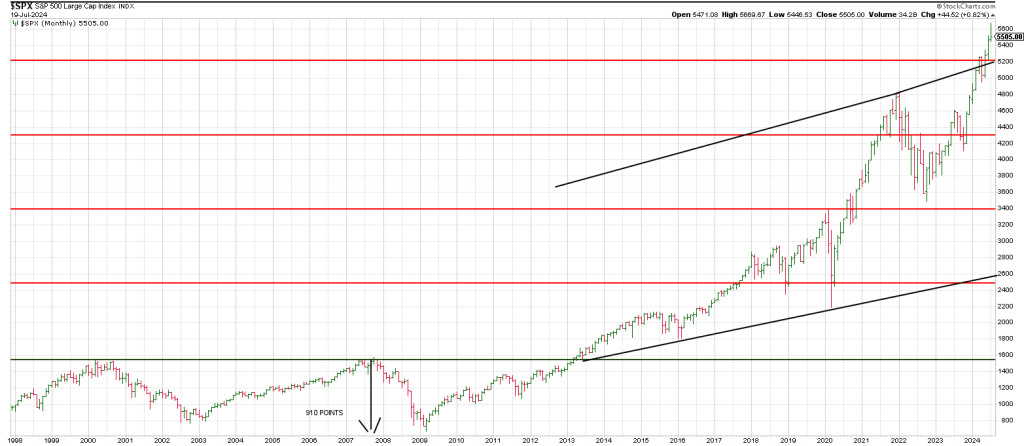
A monthly SPX underscores that the market is in the top region price wise.
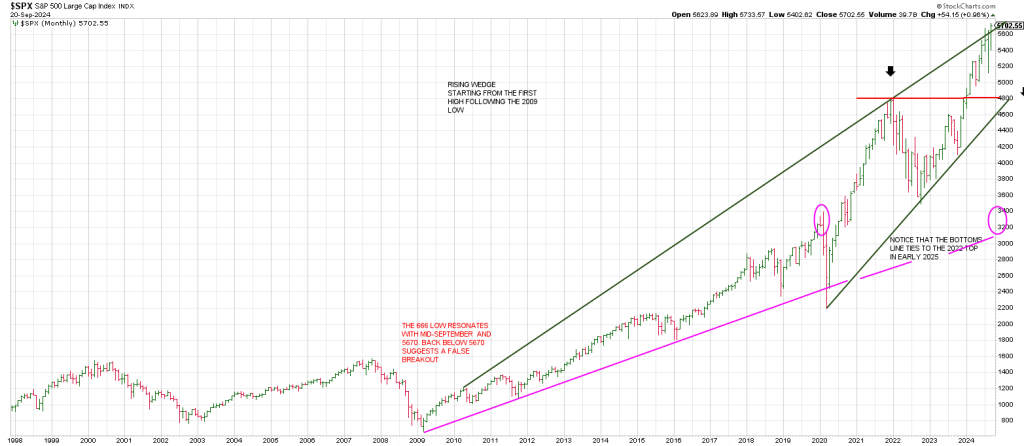
I connected the first high following the 2009 low to the 2022 peak.
This summer satisfied a third hit of the trend line.
I connected the 2020 low with the 2022 low which nailed the 2023 low producing a Rising Wedge.
The bottom of the Rising Wedge ties to the 4800 January 2022 top over coming months.
Breakage below 480 opens the door to the magenta Bottoms Line around 3100/3200…the region of the 2020 Covid pre-crash highs.
The 666 low from 2009 squares out with early September and 5670, the region of the prior highs.
Consequently back below the 5650-5670 tops suggests last week was a false breakout.
One could argue that if a super cycle top is on the table that a super throw-over could play out to 6100 ish.
However, arguably, if a super cycle is due to exert its influence to the downside, it may put a lid on a last ditch rally.
An Equal Weighted NDX left a bearish Island Reversal last week.
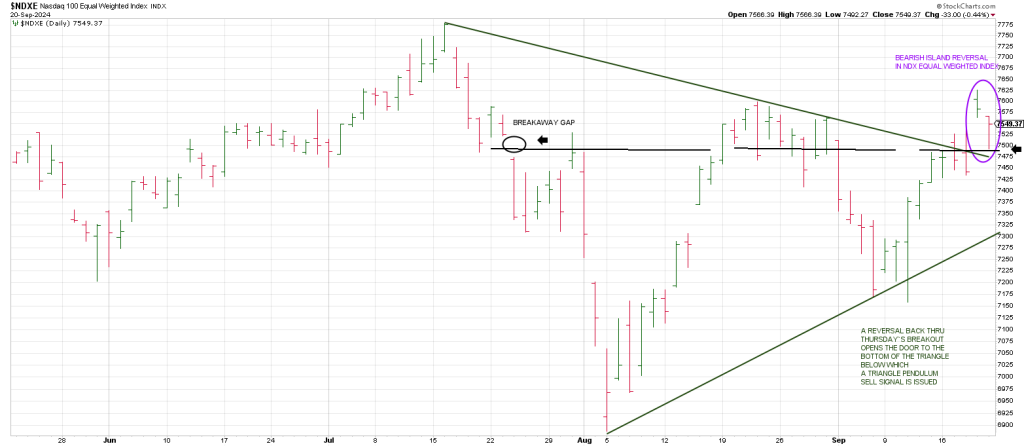
The complexion of this Equal Weighted NDX backstops the idea of this week being a turning point.
Did it breakout of a triangle on the Fed rate cut and is just checking back to the breakout point or will it fail below the top of the triangle installing another higher low?
A drop below the Bottoms Line at 7300 will trigger a Triangle Pendulum sell signal .