“Man can turn into an animal at any time. All he needs is permission.” Irene Weiss, Holocaust survivor
“Lies, lies, you’re telling me that you’ll be true.” Lies, The Knickerbockers
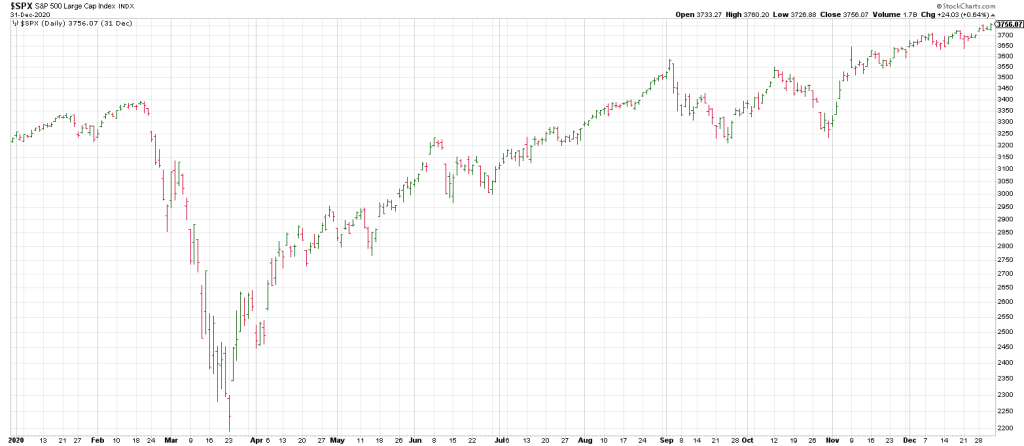
The SPX and NAZ hit record highs last week, a surreal milestone considering the SPX recovered the 1312 seven week Tariff Tantrum this spring in just 11 weeks.
It is surreal when juxtaposed against the 1201 point Covid Crash in the spring of 2020 which too 22 weeks to strike a new high.
Man it would seem can embrace the absurd and the irrational at any time, even without permission.
So the rally off the April 7th low reclaimed the plunge which had a greater point count in exactly half the time it took to do so in 2020.
Most portfolio managers, who surely know better, are go-along buyers at these heights because of performance considerations: they must look fully invested with the market at all-time highs.
With today marking quarter-end it would not be surprising to see a shake-out with some smart money cutting and running before July 1st to “beat the crowd”.
Be that as it may until a tsunami of redemptions from the Passive Trade bends money managers into the impending reality of write-downs in virtually all asset classes.
That reality was a dark cloud last week with news that the U.S. economy shrunk at an annualized rate of 0.5% in the first quarter.
Giddy investors would seem to be betting either that the recession that probably has begun will be short or that the statistic itself is a meaningless outlier caused by world class uncertainties of Trump’s tariff policies.
As well while the vast majority of investors and media alike are celebrating the end of the Iran/Israeli war and breakout of peace in the Middle East, it is worth noting that many experts echo what Lt. Col. Robert Maginnis is warning:
“The headlines may proclaim a ceasefire, but let us be clear: this Israeli-Iranian war is far from over. What we are witnessing is not peace—it is a tactical intermission. The guns may be momentarily silent but the war remains alive in motive, method and mindset.”
But that’s not what this is about.
It is about the how much further this market can push without a serious correction and the structure of that correction and if subsequently the SPX has another leg up.
It very well may.
Be that as it may, I remain convinced that one way or another a major top is due in 2025.
We’ve walked through those cycles recently— the 18 year, the 60 year for example.
Tomorrow’s report will show why economics also ‘point” to the fall.
Tomorrow’s report will breakdown where the SPX could go.
We will compare this runaway move to the Roaring Twenties using the Square of 9 Wheel.
One popular explanation for the staying power of the bull market against a backdrop of global storm clouds, geopolitical mayhem and economic shingles is that AI will save us from….well everything.
It’s going to be interesting to see what happens when the Fed starts lowering rates because the employment numbers are imploding because of AI destroying jobs.
The driving force behind AI is its ability to put people out of work.
Just like the outsourcing of jobs to China in the last few decades.
To be succinct, what additional goods and services can the lunatic companies investing trillions of dollars in AI development possibly sell us to generate untold trillions of dollars in new revenues.
Since houses and cars have gone out of reach for the broad middle class, and because AI will put enough people out of work to make the affordability problem broader and deeper, you have to wonder how we consumers will be able to satisfy the Magnificent CEO’s.
I mean all you have to do is look at Bezos wedding this weekend in Venice
The GDP pie is only so big.
Of course if AI provides an economical way to created hearts, lungs and other organs with a 3-D printer, or leads to a cure for cancer, the benefits would be enormous.
But would they come mostly in the form of savings rather than from any vast new sales.
Unfortunately for the Mag Capitalists any savings, no matter how large would not remotely suffice to reward the lot of them together with a sustainable growth-stock multiple.
And unimaginable growth is the only thing that can chip away at cosmic debt.
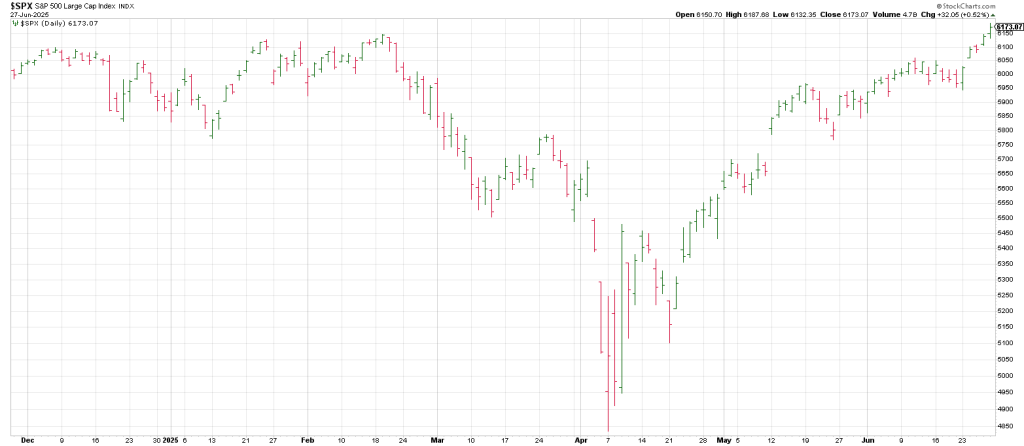
Last week the SPX close at 6173 with a gain of 3.43%. It had a range of 244 points.
The NDX closed at 22534 with a gain of 4.19%. It had a range of 1071 points.
Wednesday’s SPX NR 7 Day catapulted the SPX and NAZ to a record highs along with window dressing for quarter-end.
An up open today will convince most traders that the market will glide higher into quarter-end today.
I am not so sure.
If we get a shake-out today, putting most traders on their heels and producing concern now buyers will be on the side-lines now that the quarter is over, it is the perfect setup for the market to push higher into the July 7-8th time frame and the square-out showed recently with the July 1932 low and 93 (1932 being 93 years ago).
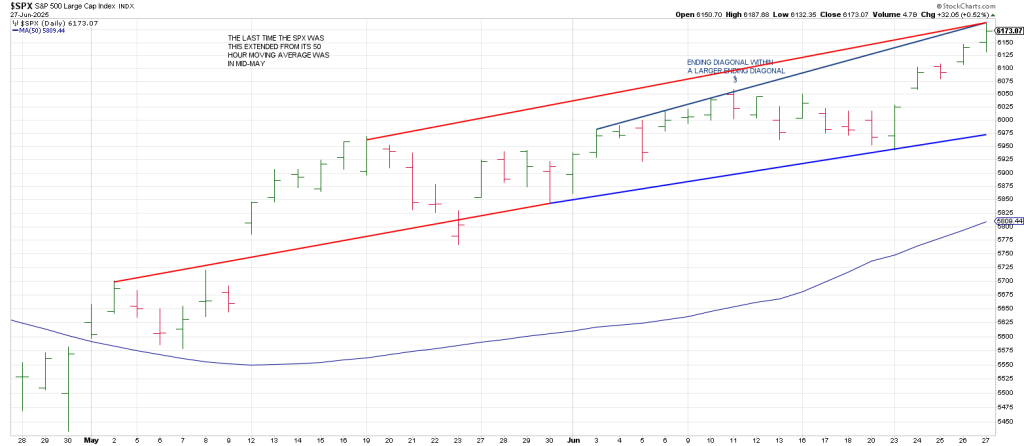
The SPX shows a possible Ending Diagonal within an Ending Diagonal.
We could easily see a shakeout of 200 points.
Let’s take a look at IWM, The Truth Teller.
IWM also “broke out” Friday.
However, in doing so, it backtested a Ghost Line from April 7th for the second time in 4 days.
Will the second mouse get the bear cheese?
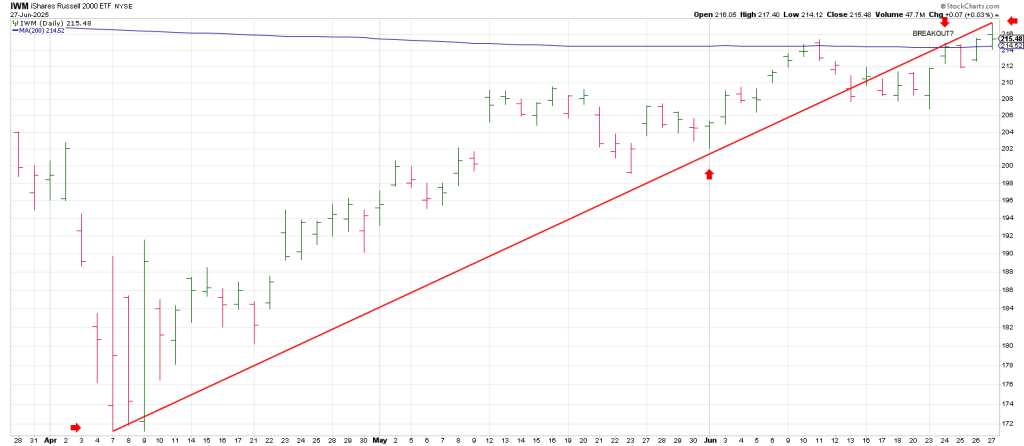
The Truth Teller has a habit of being a liar.
Often it stages false breakouts just before vicious sell-offs.
Below is a longer term IWM.
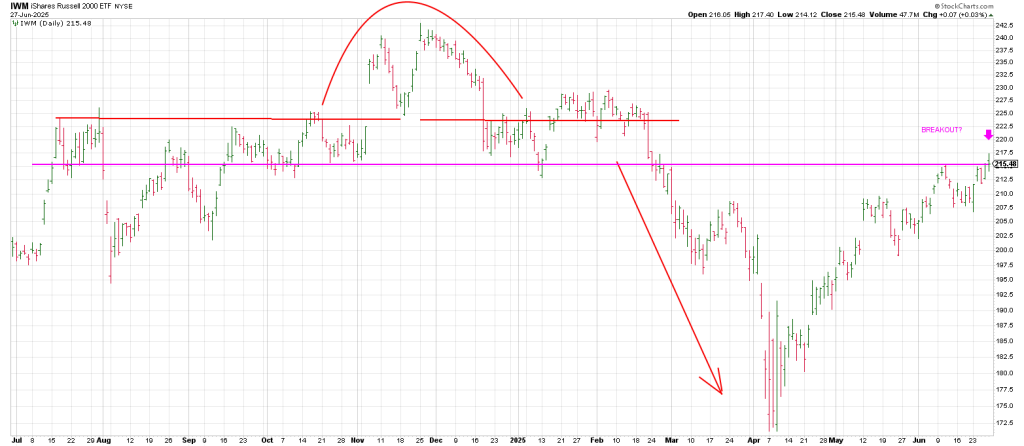
You can see the little breakout from Friday over the horizontal magenta trend line.
Notice the breakout in November 2024 that preceded the plumb line drop in early 2025.
IWM broke below the breakout point, the red trend line, but lied again in rebounding to reclaim it.
However it was a pyrrhic victor, the second mouse break below the red trend line sealed the downside deal.
Let’s pullback the lens to look at a longer term weekly IWM from late 2020.
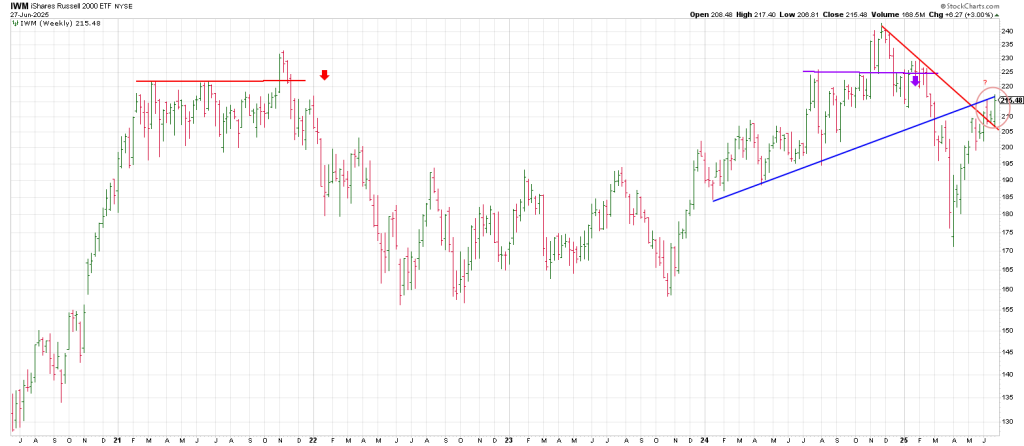
IWM carved out a 7 month Line Formation which it broke out of in November 2021.
Briefly.
The reversal back below the breakout point telegraphed the 2022 bear market.
Moving on to the late 2024, IWM broke out in November but failed, telegraphing the cascade into April.
Notice the Rule of 4 Sell signal (blue trendline) in March, that produced downside acceleration.
As you can see last weeks breakout on the dailies is backtesing the Blue Ghostline for the second time.
If it reclaims the blue line and holds, it opens the door for higher.
However a turndown here that sees follow thru opens the door to the 195-200 region.
That ties to a roughly 10% correction.
Interestingly a pullback to the 195-200 region could produce a right shoulder of an inverse Head and Shoulder.