“It’s funny how you just break down
Waitin’ on some sign” Read My Mind, The Killers
“When you understand what’s involved in winning, as do professional gamblers, you’ll tend to bet more during a winning streak and less during a losing streak. However, the average person does exactly the opposite: he or she bets more after a series of losses and less after a series of wins.” Van K Tharp
At 4:20, as scheduled, NVDA released third quarter results that beat in every category.
After all the expectations and media hype, the data release was immediately followed by lower prices.
NVFA closed after-hours at 8 p.m. at 142.25, down 4.76 or -3.24% from Tuesday.
Markets which had paused this weeks’s decline awaiting Wednesday’s report, resumed their decline in the overnight futures markets with all sectors moving lower.
Essentially, the SPX futes are giving back the last 90 minute ramp into Wednesday’s close.
You have to ask yourself after dropping from the opening bell and going sideways all day, would the SPX rally sharply to the opening print?
For someone to make us think they know something about NVDA?
If you want to game the market and you want to goose it, you start it in the last hour.
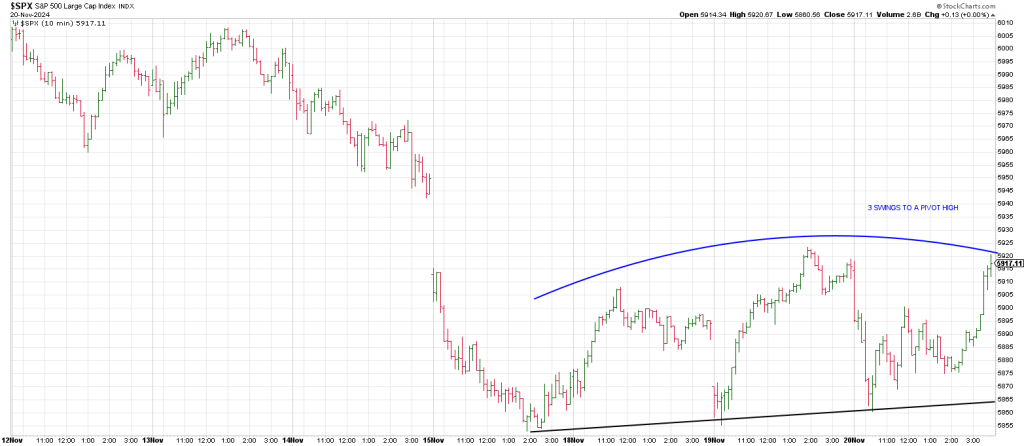
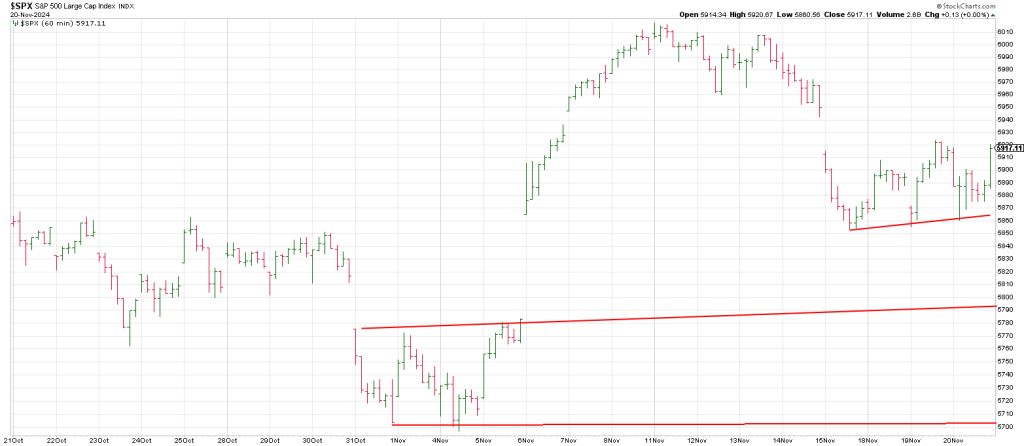
It’s part of the price accordion being traced out over the last three days since November 18th as seen in an hourly SPX.
The SPX bobs and weaves at its 20 day average closing well off its lows each session.
The dance is occurring in an effort to ‘save the baby’ from falling below its October highs.
The dance is holding on to the 5863 which is 180 degrees down from the all-time high.
The 4th time through this region and the 20 day should see a swoon.
Is today the day?
Is this overnight give-back the start of a Thursday Tumble?
If so, where do we drop to today?
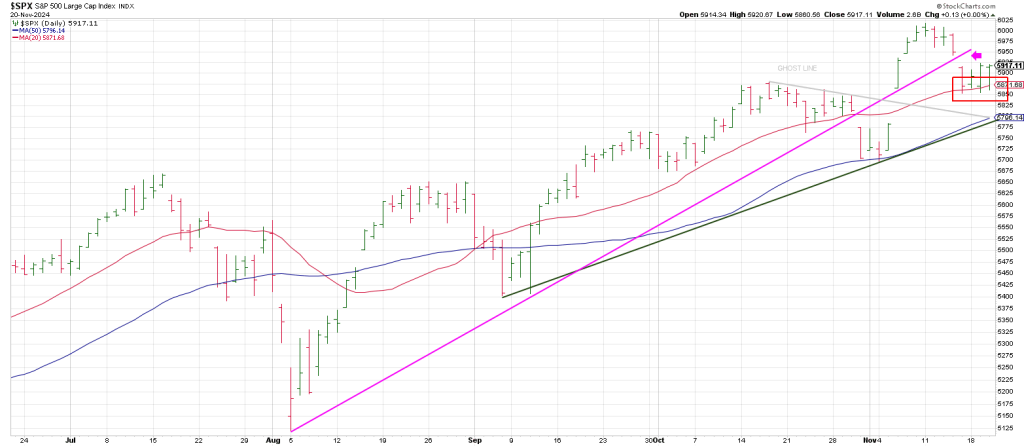
Notice the Ghost Line on the above dailies ties to the 50 day moving average at 5796….today/Friday.
That’s a big drop—we closed at 5920.
But 3 strikes and the bull’s are out?
What happens if the 50 day line doesn’t hold…assuming we drop into it in coming days?
Well, the next few days square-out with 570 (5700).
5700 also ties to the Trump Gap…It’s where Phil D Gap meets Trump.
Of course this is the 3 day ledge from October 31st thru November 4th.
In sum, optimism over NVDA (which was indeed warranted, as the report shows) has buoyed the SPX at its 20 day moving average for 3 consecutive days. After selling squalls, the index came back to close near session highs each day this week.
But meager breadth has characterized each day.
Yesterday breadth was just -200/-93.
The struggle to hold gains ahead of NVDA seems like a continuing indication of market weakness and confirmation of a near-term downtrend.
As well, is the overlapping, non-impulsive (not 5 waves) price action.
The following displays how markets finished Wednesday ahead of the NVDA report.
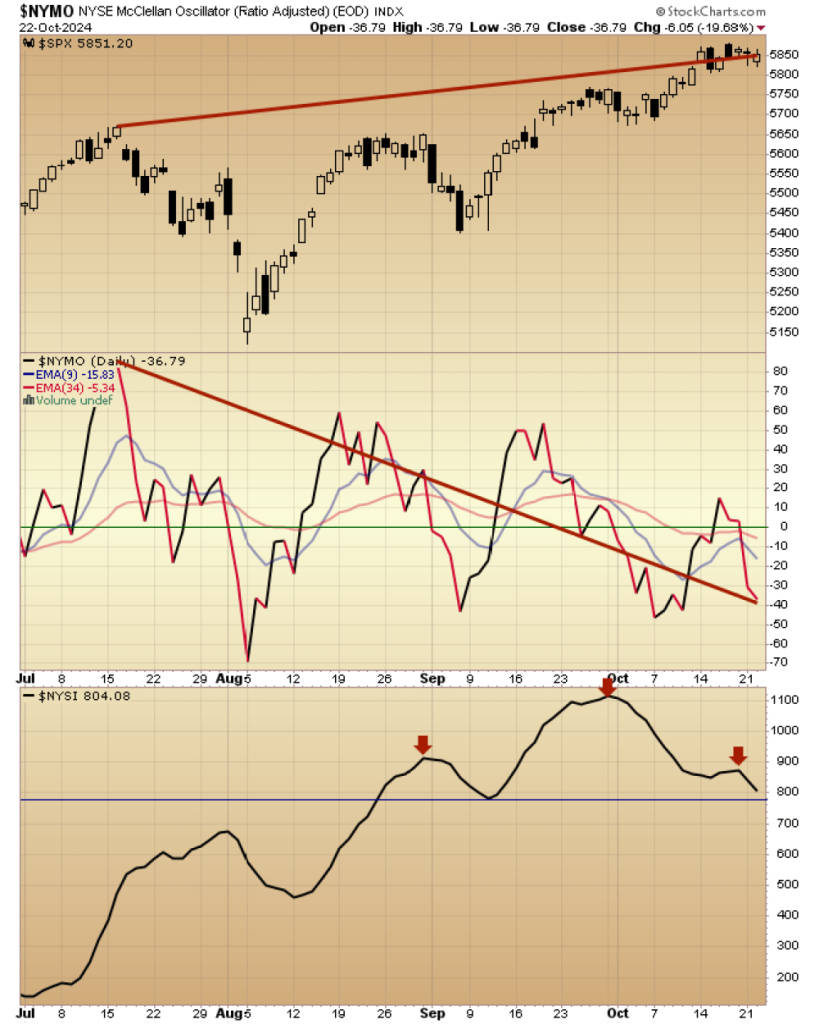
When these “Jaws of Divergence” snap shut you don’t want to have any limbs in the midst.
NVDA wasn’t the only marquee name to report last night.
SNOW had blow-out results with the stock soaring 25 points.
It was a hard one to catch based upon Wednesday’s price action, but let’s pullback the lens to see
How we can better glean the message in the future.
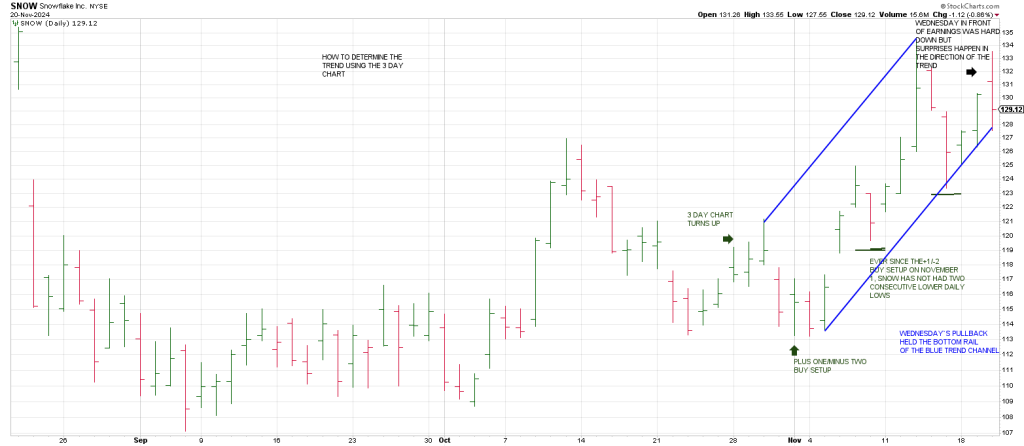
For all the noise, SNOW was in as well-defined uptrending channel.
The 3 Day Chart did as good job of defining the uptrend as it started.
The 3 Day Chart last turned up on October 29th followed by two consecutive lower daily lows satisfying a Plus One/Minus Two buy setup on November 1st.
Then there was a Breakaway Gap/Rule of 4 Buy signal on November 6gth and SNOW accelerated.
Did someone know something then?
Since the start of November all pullbacks in SNOW have seen only 1 day below the prior day’s low (not close, low).
While it’s easy to say a poor report could have seen the bottom of the short term uptrend channel squashed, surprises happen in the direction of the trend and the trend was conspicuously pointing higher…in hindsight.
In situations like this the tie-breaker is multiple time frame analysis.
So we go to the next higher degree time-frame, the weeklies.
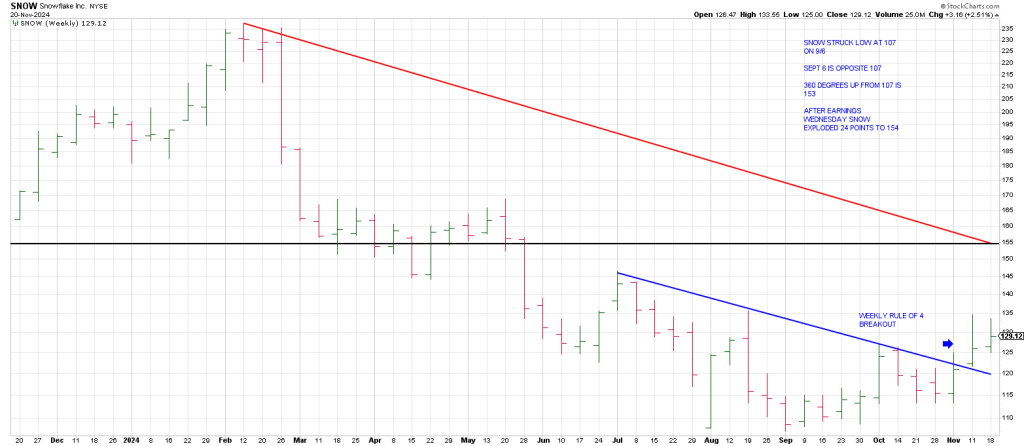
The weeklies show a clear breakout.
Moreover, it looked like SNOW would be “magnetized” to the 155 region where there is angular and horizontal resistance.
This morning SNOW is trading at 155.
The Square of 9 backstops the geometry.
SNOW struck low at 107 on Sept. 6.
Sept. 6 is opposite 107 for a Time/Price square-out.
Nice.
360 degrees up from 107 is 153.
Yes, I know, this is perfect in hindsight.
The point is the setup was there…beforehand.
If we put in the time and do the analysis, there is gold in the methodology.
And that is great news for all of us.