“And when Monday comes round—there’s a high lonesome sound” King of the Hill, Roger McGuinn
A weekly SPX from the January 2022 top shows the Head of an inverse Head and Shoulders
At the October 2022 low.
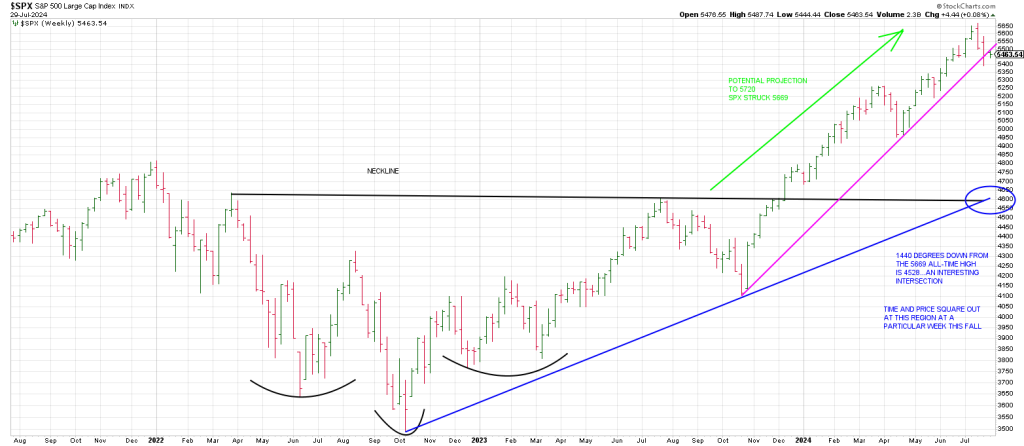
The Neck Line of the pattern projects to 5720.
The SPX struck an important high on the week of July 15th at 5669.
Close enough for government work.
The week of July 15th carved out the first Key Reversal Week since the first week of the January 2022 top. This underpins the significance of the inverse Head & Shoulders projection.
As well last week the SPX probed below a Bottoms Line from the October 2023 low.
That trend line has defined the trend for NINE months.
While the week has just started Monday left a close below this trend line.
In other words a Friday close below this weekly trend line is a big deal.
Yesterday was a first step.
A first step to where?
Extending the Neck Line from 2022-2023 intersects with a Bottoms Line connecting the two biggest lows in the last two years: the October 2022 low and the October 2023 low.
That level ties to 1440 degrees down from the all-time high is 4528.
Hit and Run subscribers know what week this fall aligns with a Time/Price square-out at 4528.
Suffice to say if this plays out is 900 SPX points below Monday’s close. A 17% drop.
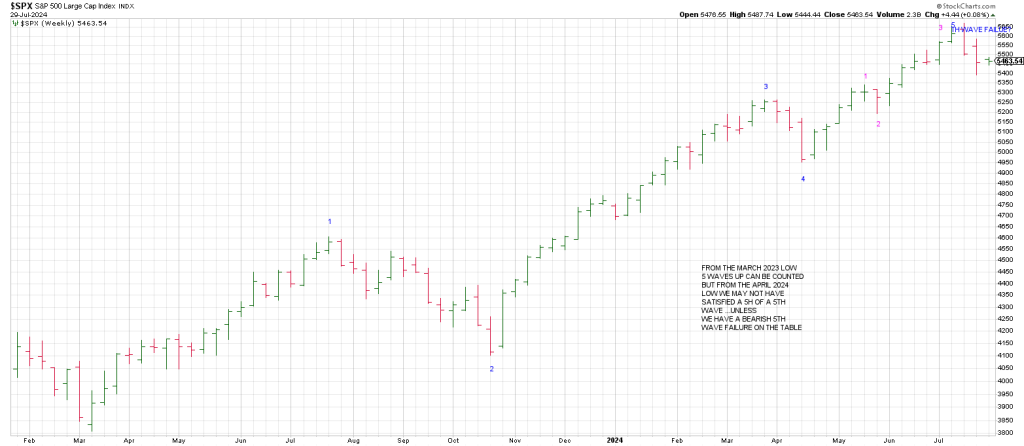
In the above weekly SPX wave labeling, the structure from the March 2023 low shows 5 waves up; however, from the April 2024 Wave 4 low an argument can be made that the high a few weeks ago was wave 3 of 5….unless a 5th wave failure is on the table.
This is a bearish setup and implies an abrupt unwind to the downside.
Monday “squares-out” with the October 27th 2023 low, 270 days/degrees ago and the SPX remained largely range bound, carving out a second inside day to last Thursday’s plunge to the low for the move off the high as the SPX hugs its 50 day line.
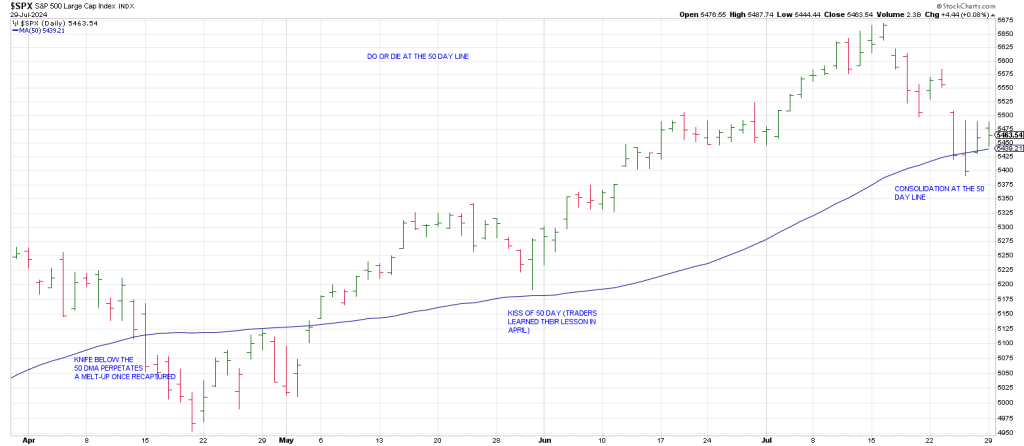
In April the index knifed below its 50 day line going into a Runaway Move once it recaptured its 50 dma.
In May the SPX barely tested its 50 before launching.
So the Principle of Alternation is playing out in spades at the widely-watched 50 day line.
- In April we got a Flush of the Fifty
- In May we got a Kiss of the Fifty
- Here in July we are getting a consolidation on the Fifty.
Remarkably for two consecutive sessions the SPX has been unable to turn its dailies up by trading above a prior days high.
When the Daily Swing Chart does turn up it is likely to be a defining moment.
The presumption is it will tie soon in terms of time and price to the top of this Wave 2 consolidation before a dramatic Wave 3 decline plays out. The potential for a Flash Crash exists based on the accelerated momentum directly off the top.
Notice the distinction between the walk-down in April from the March high versus the Air Pocketism in July punctuated by two Breakaway Gaps.
In sum, it’s do or die at the 50 day line.
The tension is on the tape with the SPX carving out two inside days with the FOMC and big tech earnings on deck:
AMD and MSFT on Tuesday
META and ARM on Wednesday
AMZN, AAPL and COIN on Thursday
The Street is assuming we’ll get a rate cut here or in September and it’s off to the races.
But if you look to see what happened after previous bubbles.
After the December 1929 rate cut the market went down 79%.
After the December 2000 rate cut the market went down 41%.
After the September 2000 rate cut the market went down 55%.
The history of rate cuts after bubbles deflate is grisly.