“Jack knife in your sweaty hands.” Hey Bulldog
Earlier this week we showed a monthly chart from 1982 with a Rising Wedge from 2020.
Let’s look at this chart again to point out a few other things.
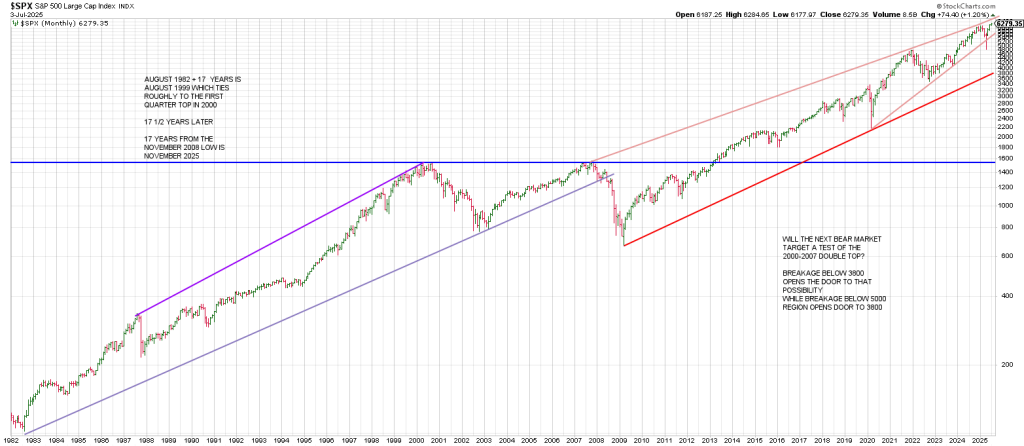
Notice how the February 2025 peak is the third touch of a Tops Line from the 2007 top.
Following Air Pocketism from the Feb 2025 peak the SPX undercut a Bottoms Line, a rising trend line, from the 2020 low.
In fact the decline this spring perpetuated a flush-out of the this Bottoms Line.
It was a failed Rule of 4 Sell signal.
A Rule of 4 Sell is a break of a 3 point trend line.
So this is why we got a stampeded following the April low when the SPX recaptured the trend line.
The Bear Trap or Undercut & Rally happened in the same week.
In other words the trend line was reclaimed the same week it was broken.
Fast moves come from false moves.
We had the mother of false moves ignite this fast move from April 7 to July 7.
Money managers who puked up their longs in the Tariff Tantrum and were underinvested had to scramble as we got a Buy In May and Don’t Go Away scenario.
They had to chase to get re-positioned.
The market was able to squeeze to a new high in the last month as there was scant overhead supply of stocks as they were jettisoned in the March/April Gann 7 week panic which ended on cue.
The 2nd quarter advance saw the SPX virtually retest the 18 year Tops Line from 2007.
This is a big deal. Especially in light of the synergy with our high basically at the anniversary of the 1932 July 8 Great Depression low.
Theoretically this could be the major top.
The T Rex in the ointment is that a hyperbolic melt-up could be unleashed if the SPX clears and holds above The Line…the line connecting the 2007 top, the 2022 top and the Feb 2025 top.
It’s a big line in the sand.
Money managers who reluctantly had to chase in Q2 after the first quarter slide. will not be able to afford to be late to the party if another advance materializes in the 3rd quarter.
My expectation remains that IF we are going to breakout above this Line of Most Resistance, that the rubber band is pulled back first with a correction.
That said another break of the rising trend line from the 2020 low should see the second mouse get the cheese for the bears.
Another break of this 5 year Bottoms Line should see the SPX plunge to the major support at around 3800.
The 3800 region could be the third point of a rising trend line connecting the 2009 bottom and the 2020 bottom.
If this scenario plays out—whether it occurs after a Star Burst pattern above the 18 year Tops Line or not—the normal expectation would be for a drop to major trend line support in the 3800 region to act as support.
Bear in mind that this Bottoms Line is moving up slightly as we get into the end of the year.
The bottom line is that a failure below the big red Bottoms Line opens the door to the 1550 region and a test of the 2000/2007 double tops.
In sum, there is a lot of synergy with this early July anniversary time frame.
Checking my Square of 9 Wheel shows that the 2007 high of 1576 points to July 7th.
As well it squares April 7th.
So the low before the 2025 melt-up points to the top before the 2007 melt-down?
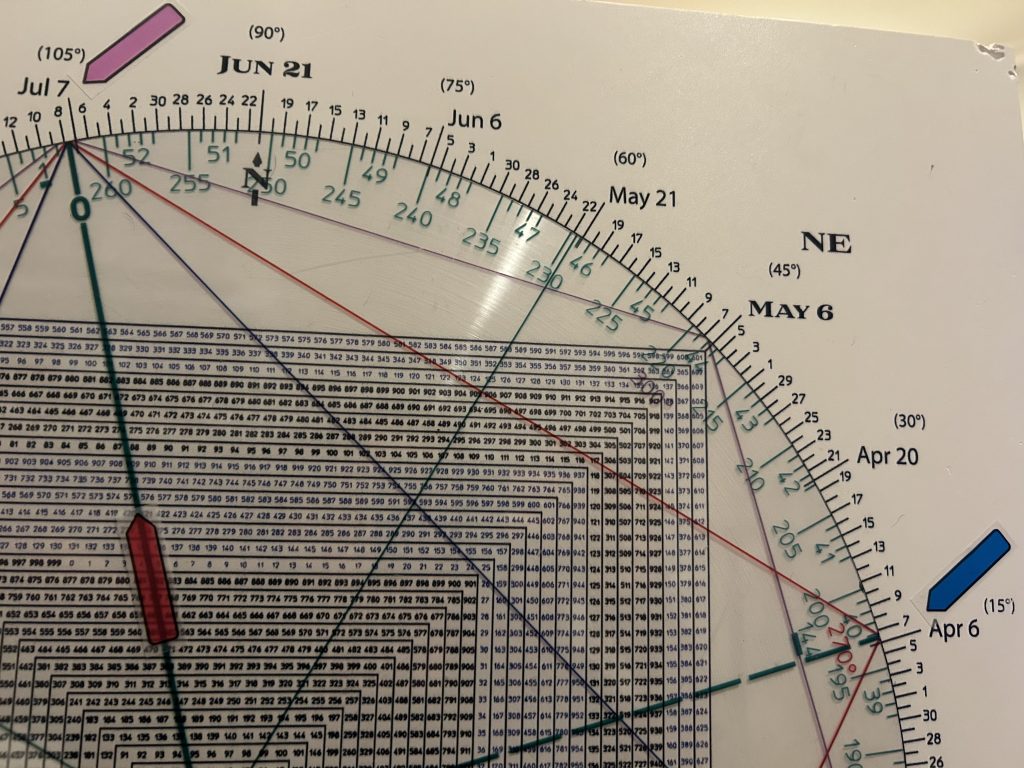
In other words there is an harmonic Time/Price relationship between the 2007 price high and the July 1932 bottom. It’s worth mentioning that the Primary High was in mid-July 2007.
That high was followed by an air-pocket into early August and a last ditch rally into October 11.
Notice how the 1576 final high in 2007 squares out with October 11.
Amazing.
Again notice how July 7th squares-out with April 7, our recent low.
Another reason why this could be a meaningful top.
Another reason also why clearing the last weeks high with momentum must be respected as signaling a Jurassic Run for the roses.
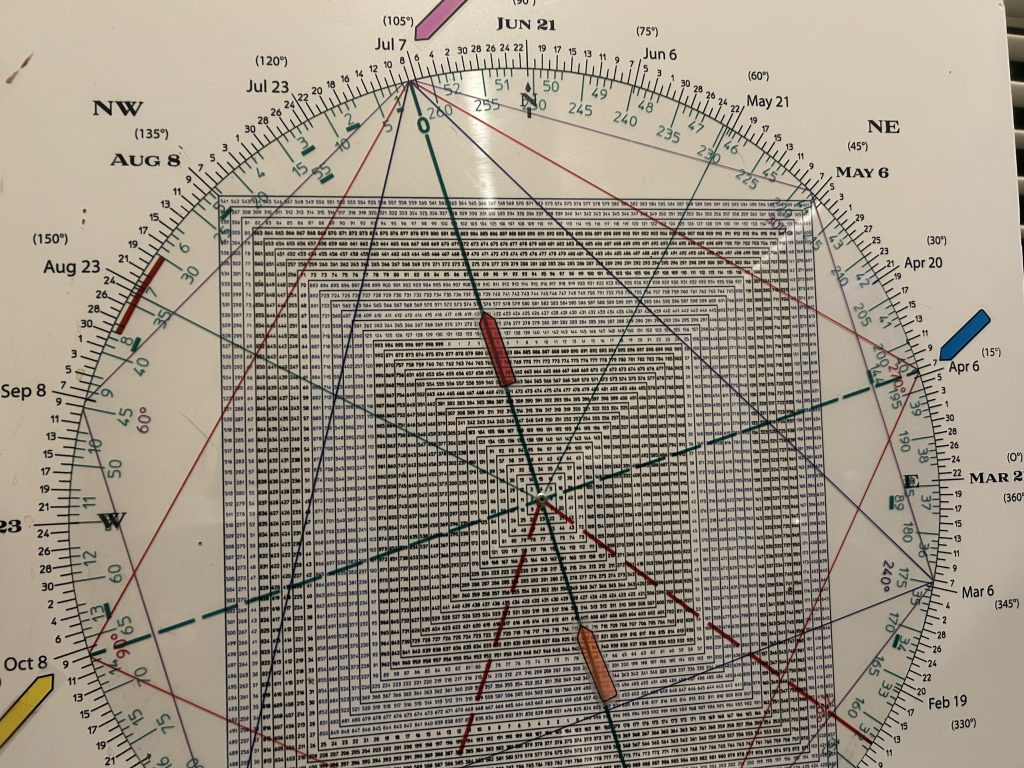
The Sq of 9 image below shows the orange arrow points to the 6100 price region which squares out with the other “spokes” on the Wheel.
The indication being that while a breakout over the 6100 region (the Feb high being 6147) must be respected, at the same time a failure back below 6147-6100 may signify a false breakout.
The current picture.
The SPX gapped up to a new high on the first day of the new quarter.
However under the surface since that gap there has been major rotation out of some Generals and into laggards.
Let’s look at some winners from Q2.
CVNA left a Combo Key Reversal Day/ Gilligan sell signal yesterday.
EAT (which Hit and Run shorted Tuesday morning on a backtest of its 20 day moving average) is seeing profit taking
DDOG a day trade a short for Tuesday, left an Island Top.
EL, a Hit and Run short swing this week, got hit by an ugly stick this week following a Breakaway Gap on Monday on the heels of 3 Drives to a High from late May.
HOOD shows a Charlie’s Angles sell pattern (3 Tails in close proximity) following last weeks rumor spike on being added to the S&P 500.
NRG, a Hit and Run short swing, collapsed Tuesday after a Lizard false breakout on June 27.
ORCL’s stunning 100% 3 month run succumbed to a reversal on Tuesday
On the other hand, money has been moving into second quarter laggards.
For example, oil names exploded yesterday, led by WFRD, TDW and FANG to mention a few.
CAVA, QDEL and DKS which suffered in the second quarter caught a bid.
The SPX hourlies show a stealth Island Top as long as Monday’s gap is not filled.
The index rebounded after testing 6205— 90 degrees down off the high.
On Tuesday the SPX left an NR 7 Day, the narrowest range in 7 days.
These contractions in volatility typically see an expansion of volatility within a few days.
That volatility may show up on momentum below 6205.
The index hasn’t even traced out 2 consecutive lower daily lows off the high so the door is open to a decline to at least 180 degrees down from high at 6127 which of course ties to the prior Feb peak of 6147.
That would be the normal expectation even in the most bullish scenario after a straight line run into a new quarter.

Square of 9 Wheel
Purchase your own Square of 9 Wheel. Shipping to US only. Contact Jeff for shipping outside the US.