https://www.youtube.com/watch?v=RSLP1FCREBA
The theme of increasing divergence between visible strength and underlying weakness—a pattern with clear echoes of prior market peaks—was unmistakable on Tuesday.
Yesterday, net DECLINES totaled 726 on the NYSE and 970 on the NAZ, even as the SPX rose 15.75 and the DHIA gained a remarkable 161 points.
The VIX advanced another 4%, underscoring the market’s rising internal tension.
The bifurcation between the behavior of the major averages (advancing) and the vast majority of individual stocks (declining) is now the widest in history.
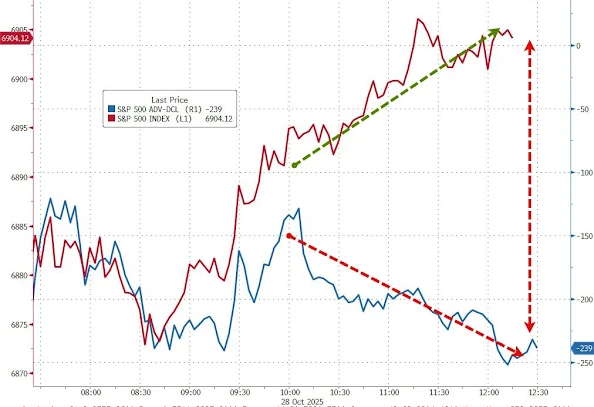
Tuesday was the most vivid example of this “jaws” ever seen—an unmistakable split between appearance and reality.
But that is what you get with a capitalization weighted index (SPXP.
That said, the numbers speak for themselves.
The DJIA left a Shooting Star or Lizard (a new 10 day high that reverses with the low and close near the bottom of the session).
The SPX left a Spinning Top indecision bar closing in the middle of its body on the 3rd consecutive gap higher.
It is amazing since the April low there has been only one example of two consecutive weekly lower lows. That was in June as the SPX approached and exploded over its February high.
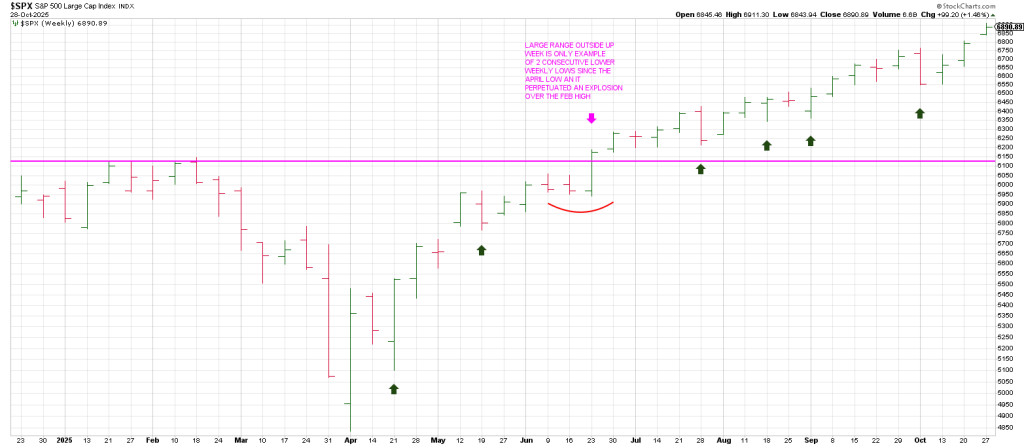
The second lower low was hardly part of a correction: it Pinocchio’d the prior weeks low and reversed to the topside with authority leaving a large range weekly reversal on the week of June 23.
Every other hint of pullback has been defined by a single turn down of the Weekly Swing Chart below a prior weeks low. Period.
The market has done a good job of making the crowd believe its invincible.
The last 7 months mirrors the 5 month juggernaut from August 2017 into the end of January 2018,
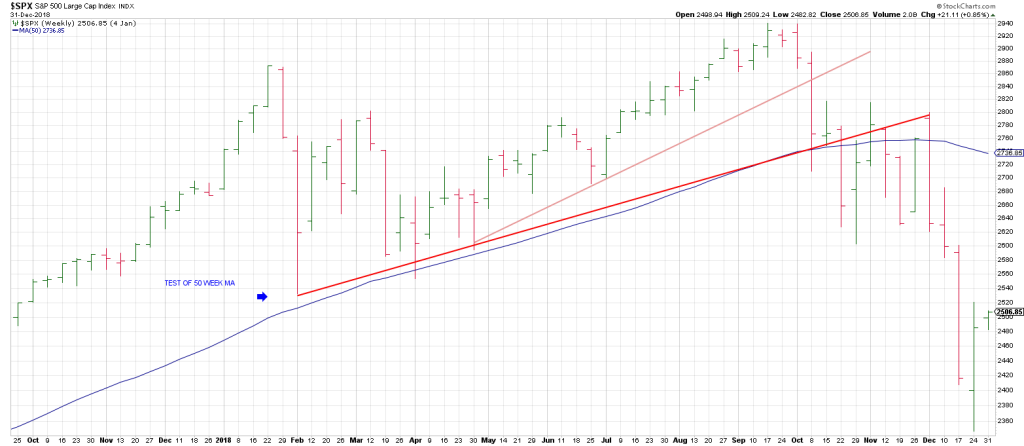
The only pullbacks during the run were defined by one-week turndowns in the Weekly Swing Chart.
The lack of volatility was an accident waiting to happen.
On January 30th, 2018, the SPX gapped down starting a 12% avalanche of selling in 9 to 10 trading days that would be known as Volmugeddon.
It set the stage for a year of volatility that culminated in the Christmas Crash of 2018.
With November’s synergy of cycles walked through in this space, next month looks like a good bet to see Volmugeddon 2.
The reversion to the mean in early 2018 saw the 50 week moving average tested.
The SPX hadn’t seen its 50 week MA in 14 months.
Currently the SPX hasn’t seen its 50 week moving average in 5 months (since May).
However we are much more extended from the 50 week than in January 2018.
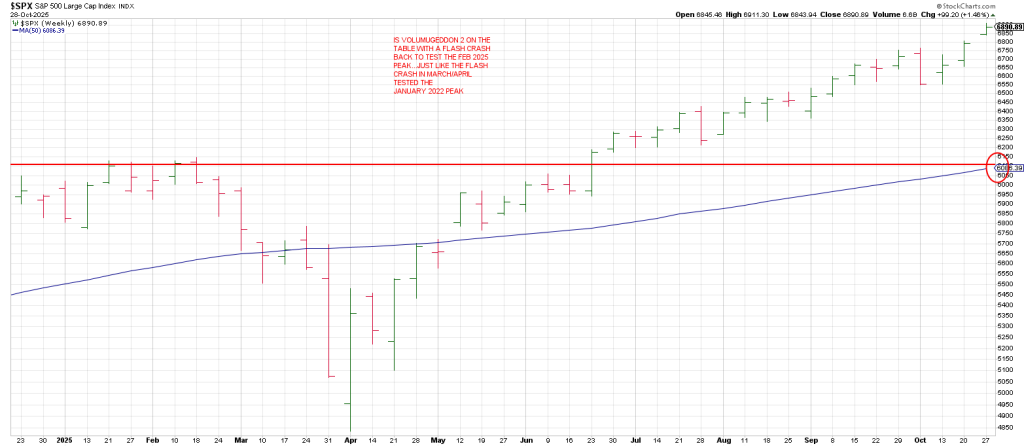
The 50 week MA is at 6077 around 800 points lower.
Interestingly this mirrors the 12% reversion to the mean in early 2018.
A Flash Crash to the 50 week moving average from this region ties to a backtest of the February high.
The SPX has carved out an Ending Diagonal or Rising Wedge since the October 2022 low.
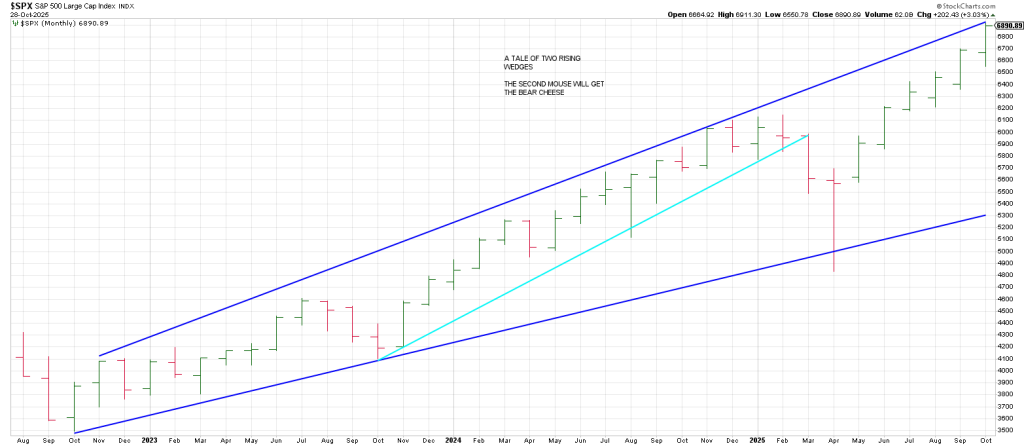
When these “Wedges” snap they produce a tsunami of selling.
Shorts have been taken out of this market in a big way which leaves a vacuum of liquidity below…
Just at a time when Buy the Dip has been newly anointed as king.
Notice that a first Rising Wedge produced the March/April crash in 2025.
Subsequently the SPX has rallied to the top of the wedge into the end of October.
Is it Halloween 2007 again when a Secondary Top was a blaring alarm for the crisis to come?
It sure looks like the second mouse of this massive 3 year wedge will get the cheese for bears and stink up the joint.