
“Got the music in you, baby, tell me why” Apocalypse
“There is a definite relationship between Time and Price” WD Gann
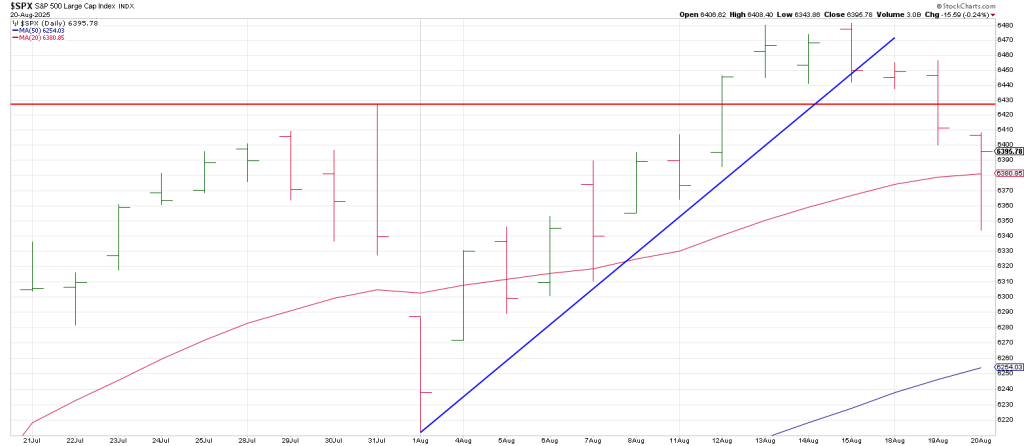
Wednesday morning with the SPX snapping its 20 DMA with authority and momentum darlings like PLTR echoing “Down Goes Frazier”, a funny thing happened on the way to the bell.
It looked like a Trend Day down with the SPX knifing thru the prior swing high, the Key Reversal Day from July 31st in concert with an authoritative break of the 20 DMA.
However the Road Map that we show each morning on the Hit and Run Private Twitter Feed
Was looking for a Squeeze Play.
As we showed this week, while the August 12 rally offsetting the large range Key Reversal of July 31
Had the potential for a bullish Reversal of a Reversal, sending the market into overdrive, the bulls snatched defeat from the jaws of the bull.
Despite the market signaling a failed breakout, the market reversed on Wednesday.
That doesn’t mean it’s not right back into the tank into the weekend as 90 degrees down from the SPX high is 6400 and the breakage below 6400 projects to the next decrement of 90 degrees down which is 6320.
The SPX looked like it was on a collision course with 6320 in the early going, sinking to 6343.
It was a scant 23 points from satisfying a 180 degree decline from its all time high.
The market plays out in these decrements of 90 degrees.
For example 270 degrees down from the 6479 ATH is 6162.
This ties to the previous swing high on July 21st of 6147.
Breakage below 6162 opens the door to a full 360 degree drop down to 6084,
That ties to the critical Breakaway Gap on June 24th that perpetuated the Runaway Move into July 31st.
If one assumed that the June 24th Breakaway Gap telegraphed a new leg up it would have been a good assumption.
If one assumed that leg would likely be at least 360 degrees it would have translated to the 6480 region.
PLTR has been the poster child for this summer’s exuberance.
From its April 4th closing low and its low print on April 7th of 66 low it ran a stunning 124 points to high of 190 on August 12.
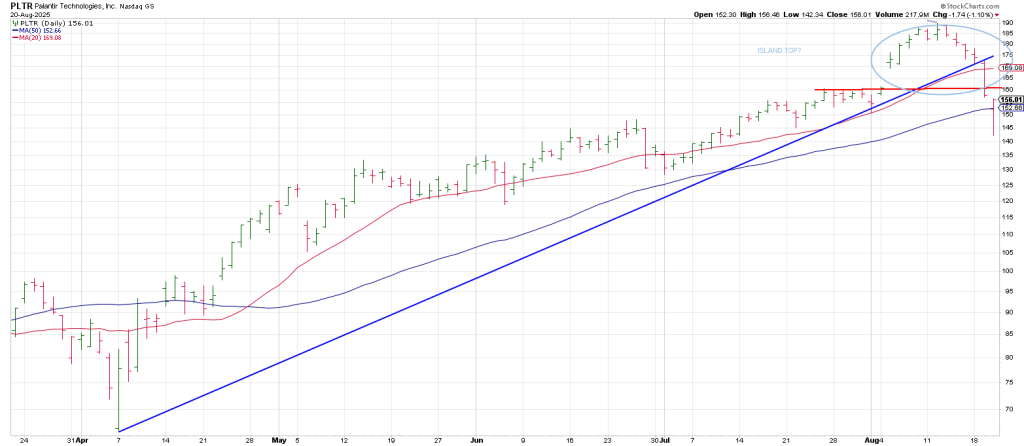
The Climax Run exploded from 161 to 190 in 6 days from a Breakaway Gap on August 5th.
In keeping with Gann Methodology, on the 7th day it turned eliciting a two day crash this week when the aforesaid gap was offset triggering a Jump The Creek sell signal.
Let’s see how the Square of 9 Wheel called it.
There are many ways to use the Square of 9.
Price squares out with price in 90 degree decrements.
Time also runs in 90 degree decrements.
For example the recent SPX high on August 13 is 180 days/degrees from the February 19th high (purple).
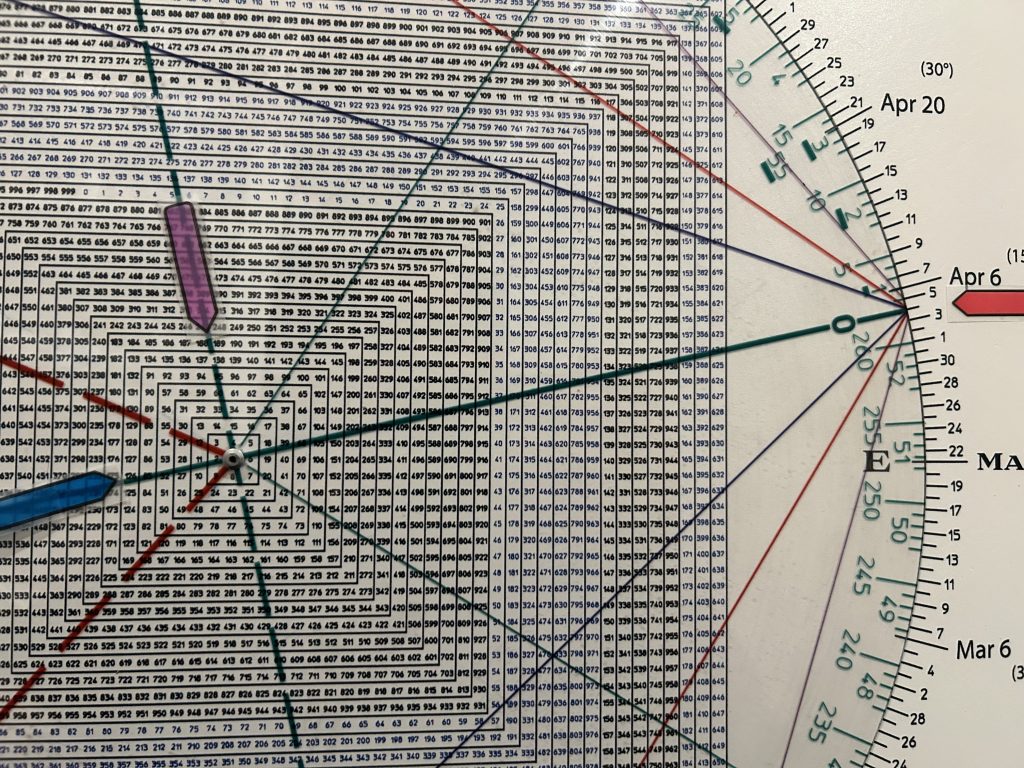
Notice that 125 (blue) is 180 degrees straight across and opposite April 4th.
125 was PLTR’s February high.
The high “pointed” to the low price in April.
Anchoring, “0” on the Wheel to April 4 shows that April 4/6 squares 189, the high.
Amazing.
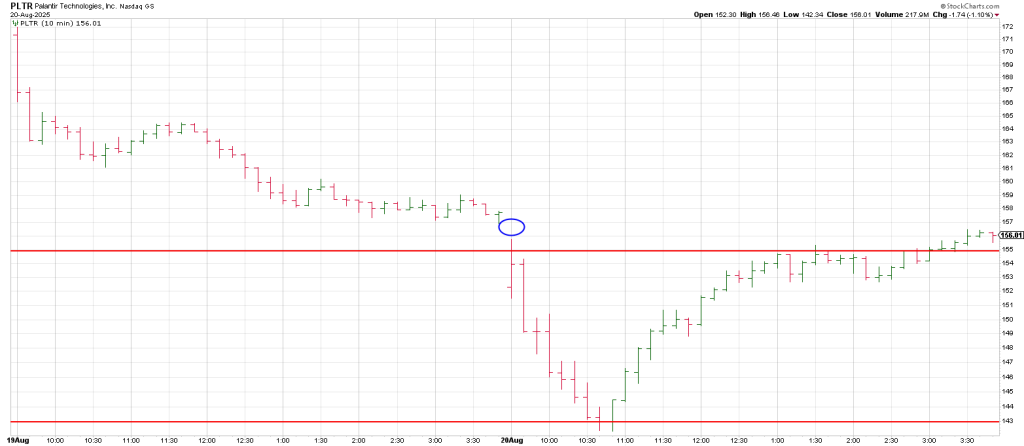
Yesterday we flagged a long day trade on PLTR from 143.

Why?
Anchoring “0” to August 20 (green) squares-out with 143 (red).
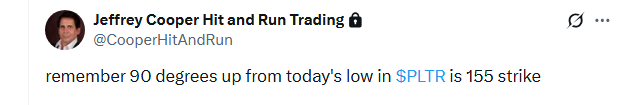
We were looking for a potential move to 155 (blue).
90 degrees up from 143 is 155.
I didn’t think PLTR would push to 155 in a few hours!
180 degrees straight across and opposite the 189/190 high is 162.
Having cleared 155, the agenda looks like 162.
That’s the impulse from the Momentum Gap on August 5th.
Mr. Market may seem like a drunk but he has his own innate geometric perfection.
Mr. Market has good genes.
What does the Wheel, let’s call her Sydney, have to say about the really big picture?
As flagged in this space since last week, 648 (6480, the all-time high so far) aligns with August 13 which is the 43rd anniversary of the 1982 August 12th major bear low.
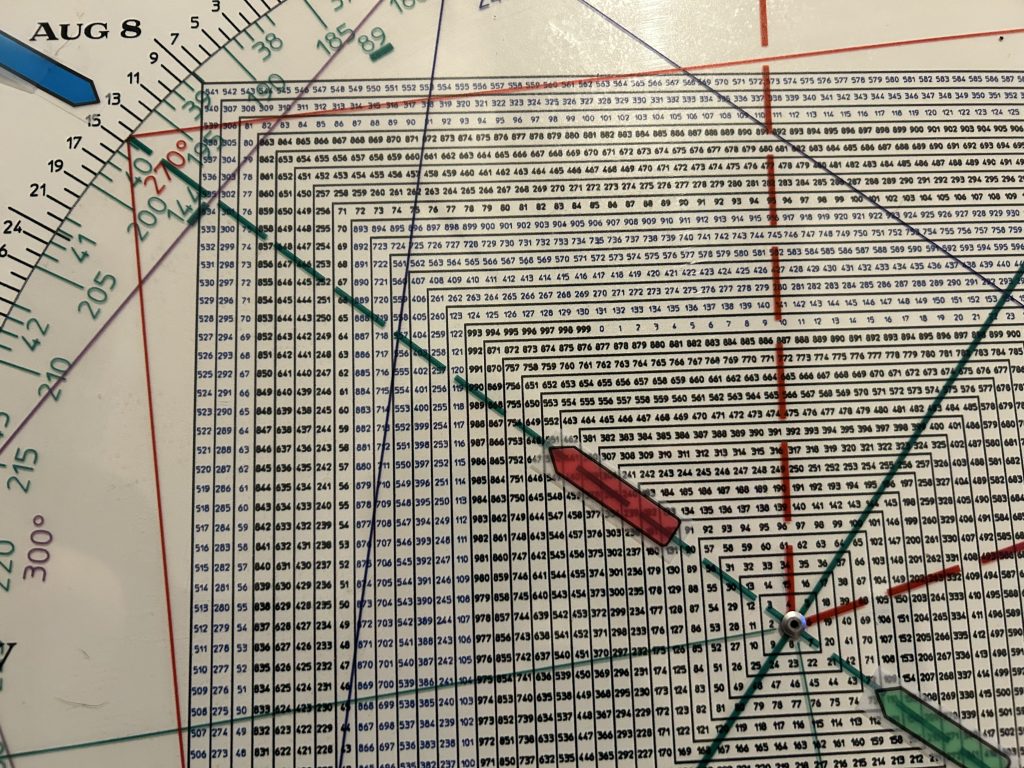
What’s stunning is that August 13, 648 and 43 (43 years ago) are on the same vector.
Maybe something, maybe nothing but it was 43 years from the 1932 low to 1975.
A major bear market low occurred in December 1974.
Maybe the market is a Rolex.

Square of 9 Wheel
Purchase your own Square of 9 Wheel. Shipping to US only. Contact Jeff for shipping outside the US.