“In all chaos, there is a cosmos, in all disorder a secret order.” Carl Jung
“He roller coaster, he got early warnin’” Come Together, The Beatle X Aerosmith
Cycles line up, divergences unfold but the market can persist to hold up well beyond these factors.
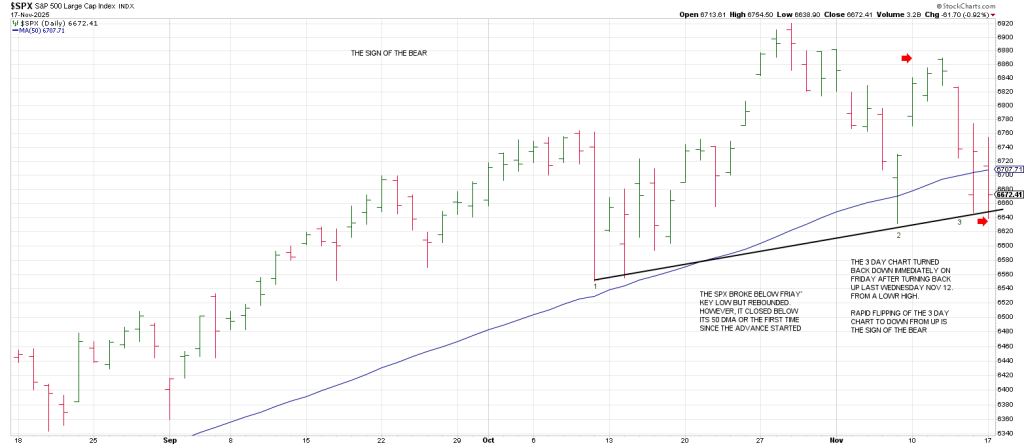
As history shows rapid flipping of the 3 Day Chart from up to down several times is the Sign of the Bear.
The 3 Day Chart turns up with 3 consecutive higher daily highs. These do not need to be higher closes—just higher daily highs.
For example the SPX 3 Day Chart turned down on October 31 directly off its all-time high.
The SPX continued lower into November 7 when it undercut it 50 DMA.
The first time the market does something it hasn’t done in a long time—such as undercut its 50 DMA— typically does not produce downside follow through.
Accordingly, the SPX rallied from Nov 7 tuning its 3 Day Chart back up on Nov 12.
When a trend is in the process of turning down, a turn up in the 3 Day Chart will define a high soon in terms of time and price.
The Nov 12 turn up of the 3 Day Chart made the Nov 7 low the “circled” 3 Day Chart low.
When this circled 3 Day Chart low is broken it will trigger a Time Turn Trend sell signal.
This will backstop a 1-2 downside structure likely coincident with the onset of a powerful Wave 3 decline.
While the SPX did undercut Friday’s key low of 6646, the index rebounded somewhat on the runoff.
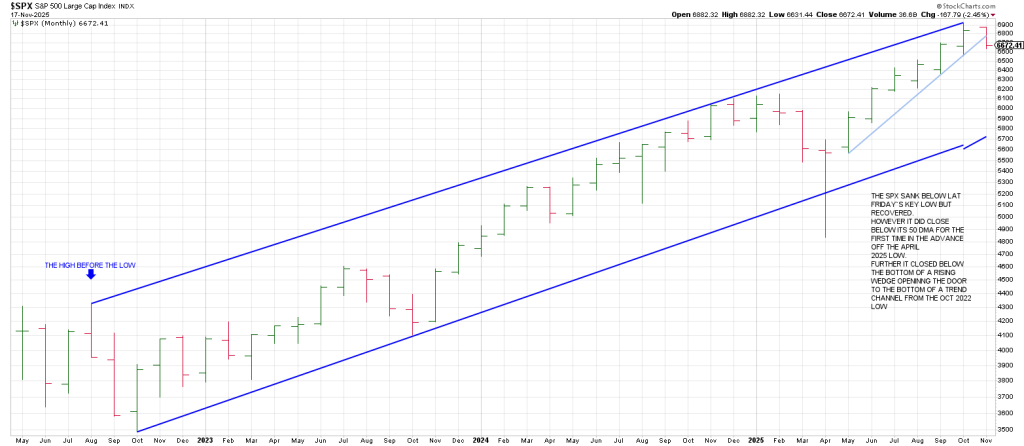
Be that as it may, Monday was the first close below the 50 DMA since the advance from April 2025.
The CIRCLED 3 Day Chart low of 6631 is in effect The Sign of the Bear.
As you can see the SPX is also threatening a Rule of 4 Sell signal on breakage below a 3 point trend line.
When it occurs a minimum projection to 360 degrees down from the 6920 ATH.
That level is 6590.
That ties to the Oct 10th 6551 low.
A 540 degree cube-out is 6428.
720 degrees down from high is 6269.
This ties to the Key Reversal Week low from the week of July 28.
However, the presumption for a powerful Wave 3 decline is a 50% retrace of the advance of the range off the April low.
This number is 5877. This ties to the low of the explosion bar to the topside in late June.
Breakage below a Trend Channel from the October low is currently at 6300.
That is the minimum expectation when the Rule of 4 Sell is triggered.
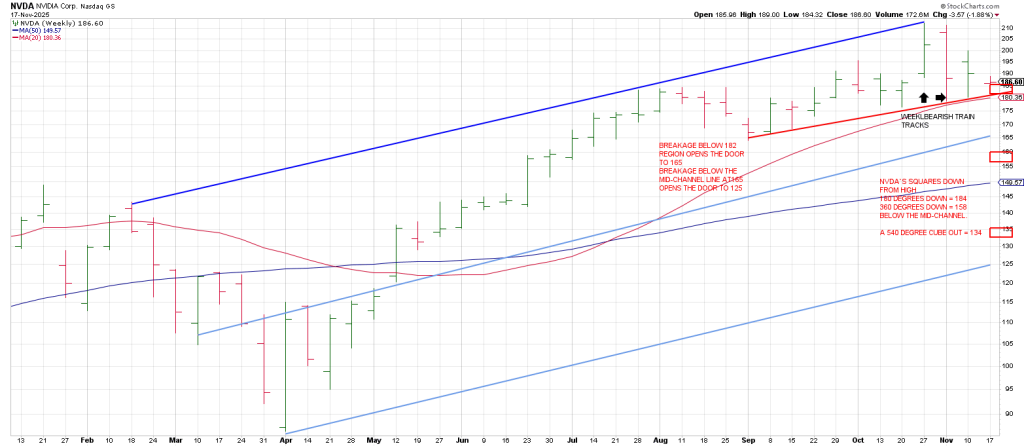
It looks like NVDA’s earnings Wednesday will be the catalyst…for the downside trigger or one more option wipe-out for November Monthly OpEx on Friday.
A weekly NVDA shows bearish Train Tracks.
In sum, it has now been 19 days since the SPX topped on the 96th anniversary of the 1929 Great Crash potentially fulfilling another synchronicity with 1929 flagged in this space over the past months.
If lower highs and lower lows persist the market will waterfall before the books are closed on 2025.
The SPX all time high is 6920.
692 squares out with early December.
So although the market may get oversold,, don’t underestimate the damage that could be done into that Time/Price synchronicity.

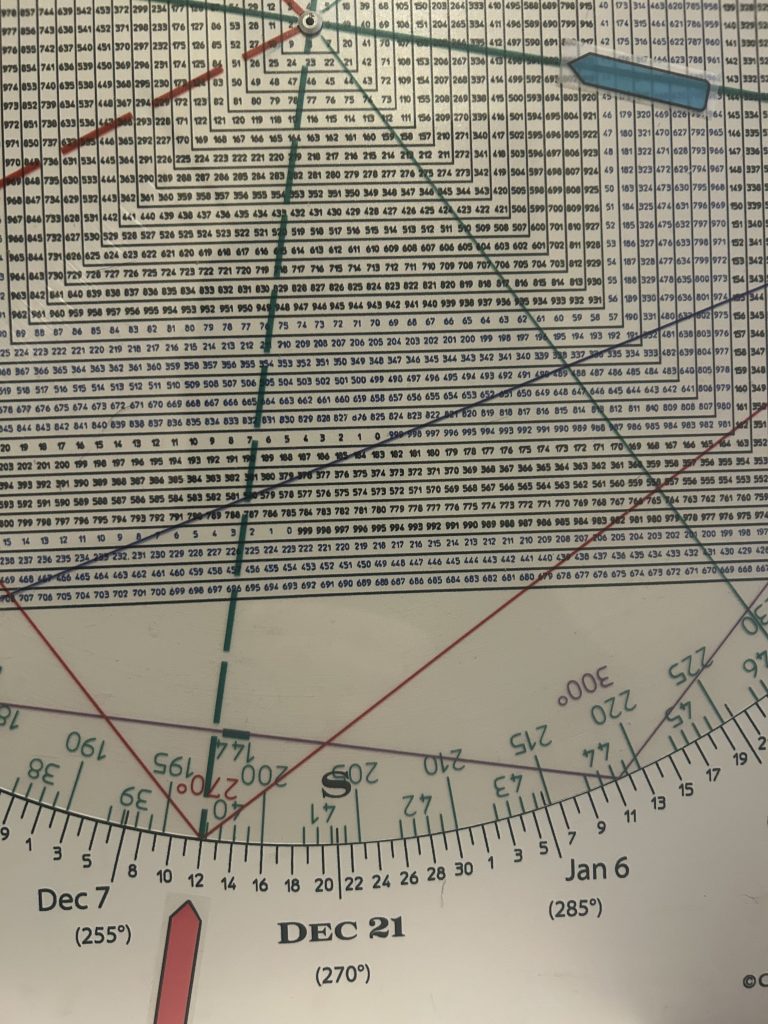
Square of 9 Wheel
Purchase your own Square of 9 Wheel. Shipping to US only. Contact Jeff for shipping outside the US.
A free ebook on how to use the Square of 9 Wheel is available at cooperhitandruntrading.com
As well the Wheel is available for purchase.