“If it keeps on rainin’, levee’s goin’ to break” When the Levee Breaks, Led Zeppelin
As is typical of the market, it deviated from expectations of downside acceleration from the 49th calendar day from the January 24th Primary High.
The 49th calendar day was Friday March 14th and it was a big rally day.
As offered, I guarantee you the Fed and other powers that be are well aware of this pattern/cycle.
Also as pointed out by fellow traders on the H&R Private Twitter Feed VIX expiration was moved up to Tuesday instead of Wednesday due to good Friday as a 30 day period is needed.
When “they” take them up big on the Friday before a monthly OpEx, often times they take them down hard on the monthly Opex itself. That’s this Friday.
As well, Mr. Market’s job #1 is to deceive.
Just as you think you have the key to the market some SOB changes the lock.
The natural question is: where do stocks go from here? Is the coast clear?
We must keep in mind that the leading stocks and the indices were much weaker going into day 49 before staging this rally.
As noted yesterday, in some respects we are weaker than the 1929 pattern because we dove below the 200 day well before the pattern/day count from 1929.
From an historical perspective, when a bubble begins to burst, the market typically rallies for about 5 trading days immediately before the all-out panic phase.
If the current bubble is bursting, then the expected counter-trend rally may be viewed as an A B C corrective rally in the lead index, the NDX or QQQ.
The counter trend rally actually took place disguised initially from last Tuesday thru Monday in this thesis.
Last Tuesday a few key stocks began recovering after the plunge last Monday.
In this case, the Panic Phase is set to begin at any time if the heart of the waterfall is to coincide with day 55/56 as history suggests.
Interestingly, the 56th calendar day from January 24th is Friday, March 21st, the first quad which of the year and it falls on Gann’s Zero Point, the Vernal Equinox.
Natural cycles can get tweaked for right or left translation by the eclipse cycle.
The idealized theoretical eclipse cycle peak for the counter-trend rally occurred with the lunar eclipse on Friday March 14th.
It’s always + or – a day.
The indication is that stocks will decline sharply during the next 2 weeks.
Remember even if the wheels do come off, the market can continue lower after the Selling Climax per se.
That takes us into the solar eclipse on March 29th.
Since we have walked thru the big picture cycle possible from 1932 culminating, it is compelling that there was a solar eclipse on November 1st, 1929 and the big crash days that year occurred on November 24, 28 and with the crescendo on October 29th.
Below is a daily DJIA from 1929 we’ve showed before but it bears looking at again.
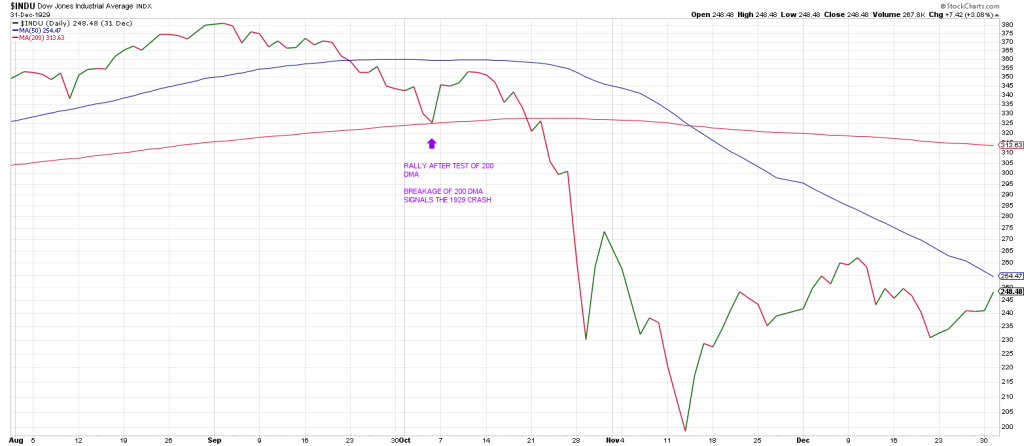
Notice the 5 trading day or so rally after the kiss of the 200 day moving average.
Then it was Katy Bar the Door. (KBD)
Other than time and price, one of the ways to portray the magnitude of the NDX bubble are indicators of financial leveraging.
For example, the extreme high levels of margin debt combined with relatively low levels of collateral (free credit balances). This signals danger ahead.
A fresh margin debt update is due this week.
At the same time the latest CFTC commitment of trader’s report shows that speculators hold outsized long-positions in the SP E-mini futures contract.
This goes hand in hand with our note yesterday regarding the massive buying the dip by wealthy individuals at BofA.
Hence, deleveraging has been minimal on the retail side.
This is in contrast to reports surfacing last week that hedge funds such as Citadel were seeing forced deleveraging.
Overall, reports suggest when all forms of leveraging are combined, deleveraging has likely started but the amount remains relatively small compared to outstanding totals.
Thus, it is fair to say that further major deleveraging lies directly ahead:
It is positioning and sentiment that are the center of the trading universe…not fundamentals and value.
One tell-tale signal of massive and sometimes forced deleveraging (translation panicky selling) is an explosion in trading volume.
If we see NYSE and NAZ volume double or triple in coming days, then it is almost certain that forced deleveraging is taking place.
For example after trading volume surged last Monday, the gradual contraction in trading volume during the remaining four day sof the week signaled reduced selling rather than a surge in buying.
This is an indication of the stealth recovery preceding Friday’s ramp.
As well even while bullish sentiment is fading, the 10 week average of Investors Intelligence bulls/bears indicates that sentiment must decline further before the market reaches a meaningful low.
That was not Thursday.
The VIX contraction from 29 to 22 on Friday underscoring the idea of a stealth recovery last week points to the relative complacency in the market.
During a true capitulation/panic the 1 day VIX spikes to north of 80.
This will be consistent with investors realization that it is hard to reconcile the huge divergence between record stock market valuations and a collapsing economy.
Tomorrow’s report will show charts reflecting just how unsustainable the economy is.
Is A low in?
6% takes out Friday’s low. When “The Low”, The Levee breaks, it will be a come to Jesus moment for the Buy The Dippers.
Yesterday, we stated that the NDX the lead index, should not be able to clear 19,910 in the next 3 days.
The bull case is that the next 3 days see a high level consolidation, a Bull Flag.
The bear case is if a Wave 3 begins.
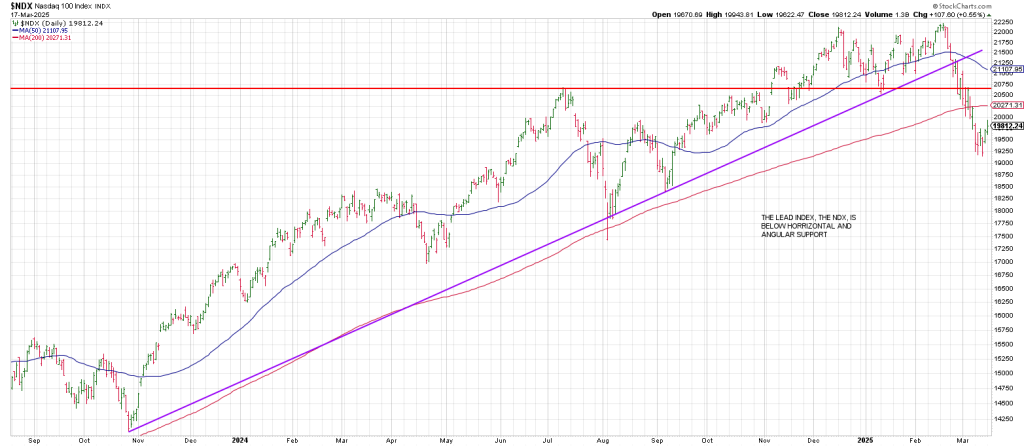
- The lead index, the NDX is below both angular and horizontal support. It has broken a Bottoms Line from the major October 2023 low. It is below the summer highs.
- NDX is below its 50 day moving average and 200 day moving average. The 50 DMA has rolled over. The 200 DMA is curling over now
- The breakage underpins a double top.
With the Gann Panic Window wide open this week in tandem with an FOMC meeting and an SPX Minus One/Plus Two sell setup on the table, Mr. Volatility is in the spotlight.