“I was caught in the middle of a railroad track
I looked round and I knew there was no turning back.” Thunderstruck AC/C
Momentum stocks are splintering.
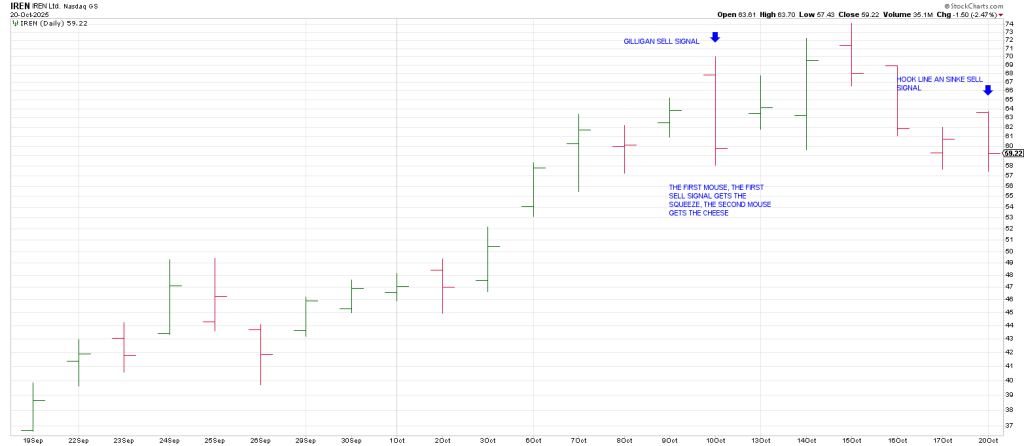
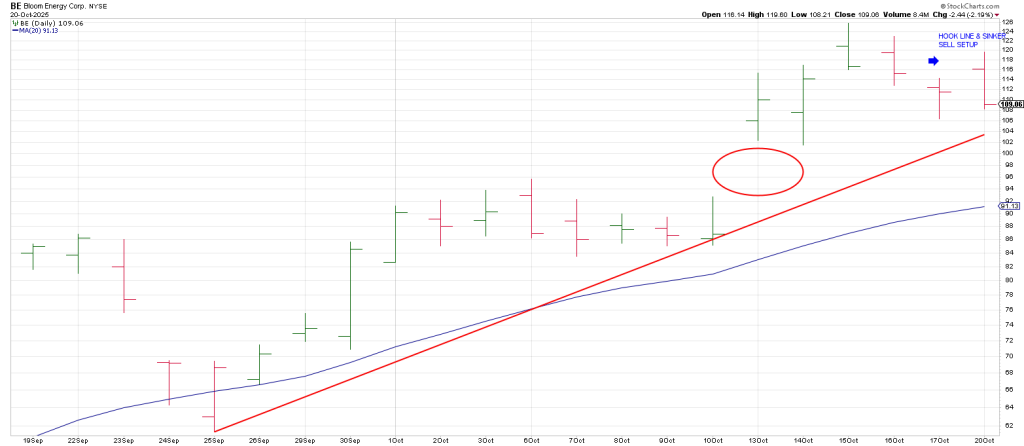
Many have Hook Line and Sinker patterns which means they tried to turn up from pullbacks and knifed back down.
Names include IREN and BE on Monday.
NBIS is another momentum amigo that shows an 11 day Island Top with a Breakaway Gap below its
20 DMA on Friday and downside continuation on Monday.
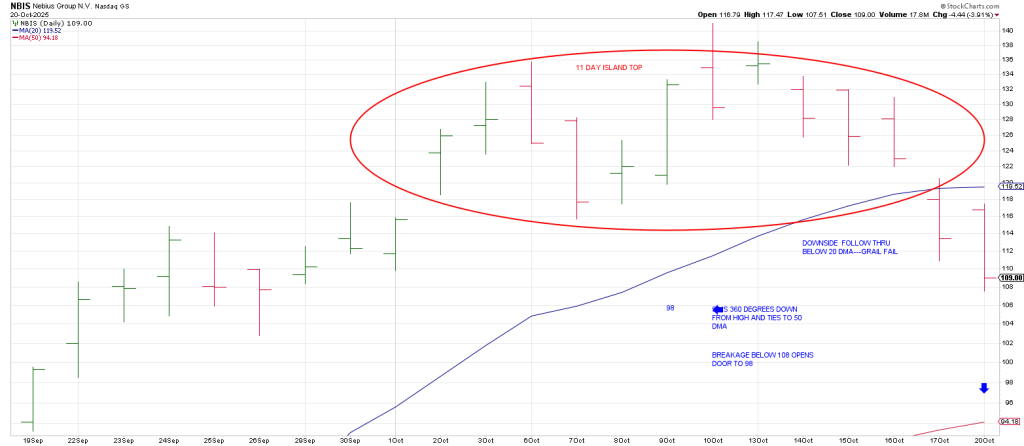
When strongly trending stocks fail at their 20 DMA’s the first time down caution is warranted.
In a tape like this you are quick or dead. It’s a very unforgiving market when momentum pullbacks aren’t met with the same enthusiasm as we’ve been used to.
That doesn’t mean that they won’t find support at deeper pullbacks and turn back up but for the moment they are suspect.
STX is a good example of how a stock can go from loved to abhorred.
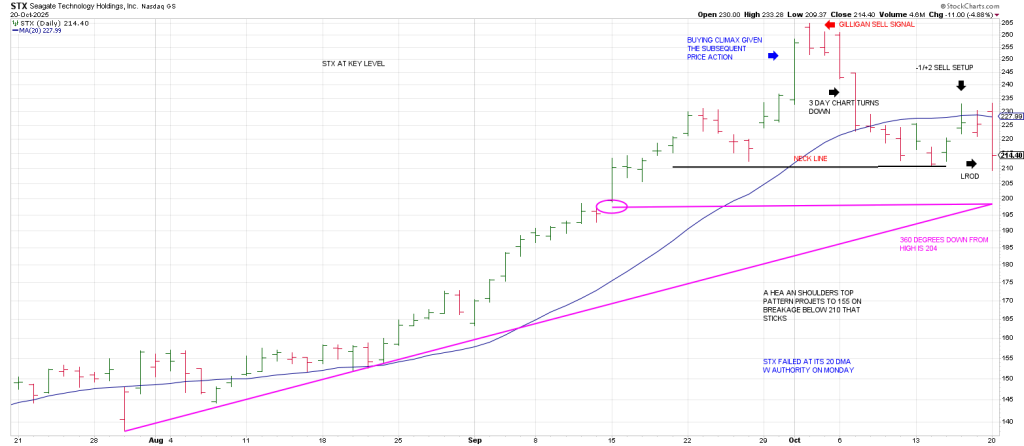
STX exploded entering October with a large range day. The next session it left a Gilligan sell signal.
Since then it’s been a series of distribution days.
On Thursday STX left a Minus One/Plus Two sell setup.
Following a Pause Day on Friday, STX opened higher on Monday and then got beat with an ugly stick
Dropping from a high of 233 to a low of 210.
204 is 360 degrees down—just above the 50 DMA.
As well STX has what looks like a Head and Shoulders top pattern with a Neckline at 210 ih.
Breakage opens the door to 155.
That represents a round trip from the August Slim Jim where it went parabolic.
Despite the pressure in these glamours, the Q’s closed at an all-time high Monday.
That said it may be working on an A B C ….A down Oct 10, B up right here and C down if we reverse.
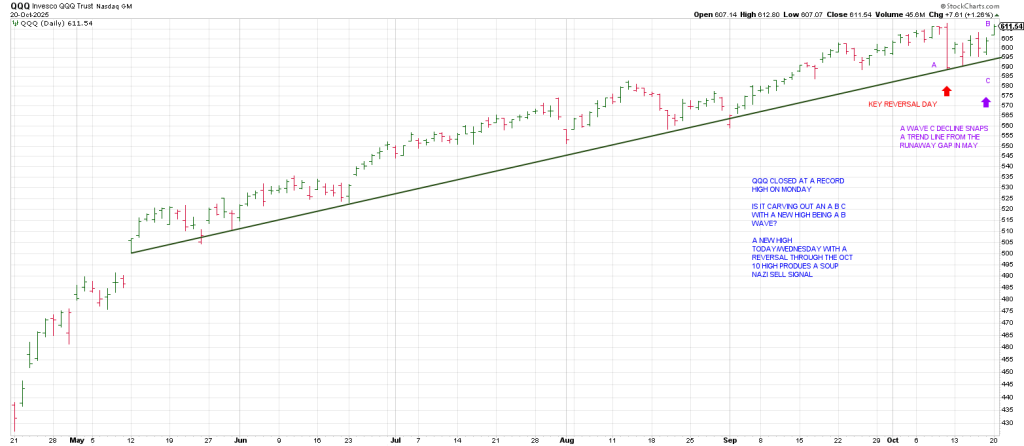
What we want to be on alert for is a new high above the all-time intraday 613.18 and a quick fade that follows through to the downside below Monday’s up gap.
That would trigger a Jump The Creek sell signal underscoring the notion of a C Wave down..
If so notice that a C Wave would snap a trend line from May.
A Rule of 4 plus sell.
As you know I have had early to mid-November on the radar for a possible major top for a while.
1) The secular bull market that started in 1982 is 43 years old.
43 squares-out with November 7.
2) The year 2025 squares-out with November 7 as well.
As well there is an astro cycle I call the Crash Cycle that hits on November 4th.
That does not mean we will crash on November 4th.
To the contrary if the SPX spikes up to 7000 region in early to mid-Nov, the presumption is that is a major high.
Let me give you a few dates when this cycle has shown up:
Sept 7, 1929. No comment necessary.
March 9, 1962. The DJIA topped on March 16 and crashed in June 25.
June 17, 1977. The DJIA was already heading down but accelerated from June into Feb 1978.
June 1, 1981. The DJIA topped and tumbled into early August 1982. The low.
May 14, 1987…3 months before the top and 5 months before the crash.
August 29, 2000, the day of the Secondary Top prior to the bear market into Oct 2002.
August 6, 2008, The DJIA crashed from Sept into March 2008.
November 24, 2019…a few months before the Covid Crash.
November, 2021, direct hit.
November 4, 2025.
There are other dates besides these. The takeaway is the ingredients for a crash need to be present.
The point is every crash has happened “around” this cosmic signature.
Let’s say we spike into 7000, the number of panic.
Interestingly 703 (7030) is a corner (strong) number on the Sq of 9 that squares-out with November 7.
Alternatively early November could be a launching pad assuming there is another leg up.