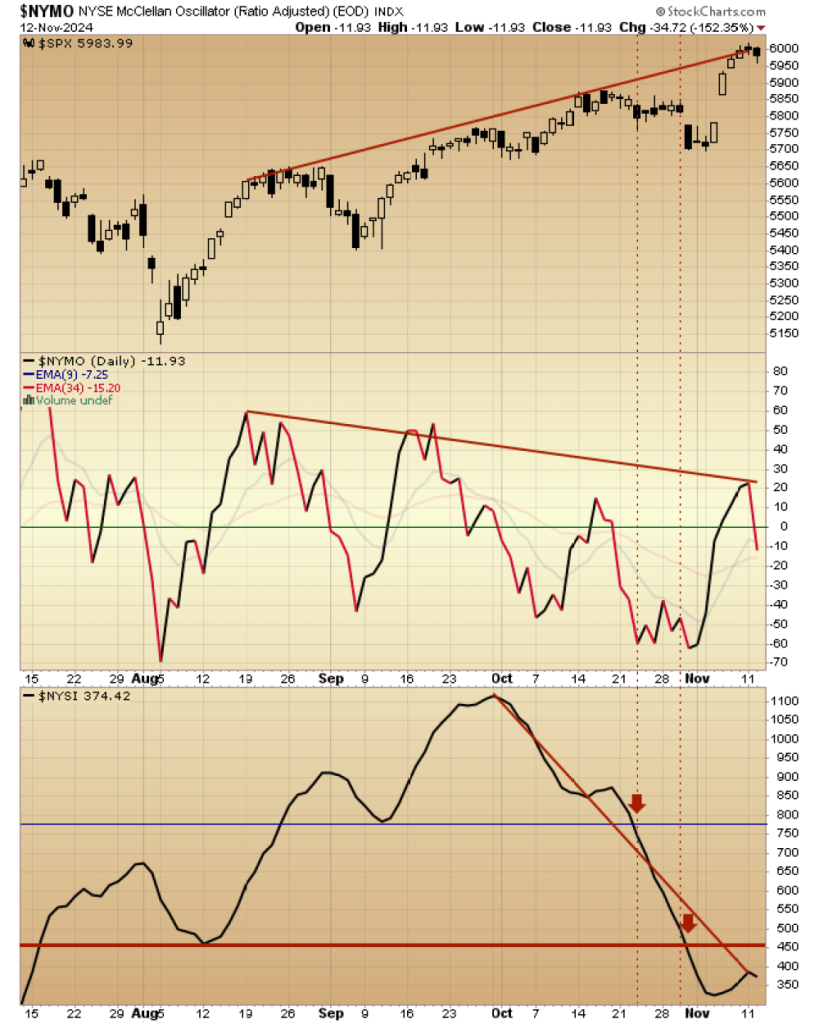
With the SPX slipping by 17 points and a resounding net declines on the NYSE, Tuesday’s market action was enough to reverse the McClellan Oscillator from its recent high of +21 back below zero in just one trading session.
The slide stopped down 40 points at 1:00 Et followed by a rebound to the flatline prior to selling off again to close down 17 points.
The SPX failed to strike 90 degrees down at 5940, but a C wave or Zig Zag decline could satisfy 5940.
Be that as it may the selloff eroded last week’s gains in these important momentum measures, underscored by last week’s 3000 point DJIA rally.
Yesterday place the Summation Index back into a downtrend after only a bried 3 day rise.
The abrupt shift illustrates the fragile nature of the rally which despite remarkable rockets, lacks the underlying strength to suggest it is the beginning of something but rather the tail end of something.
The lasted of the Rocket Men is CAVA up 23 after reporting.
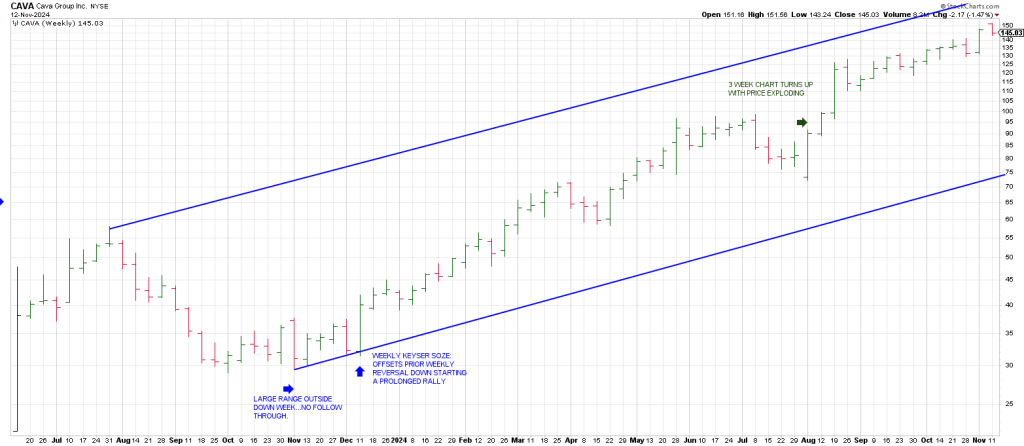
It joins the club of
WDAY
FTANAT
ZS
DAVE
SHOP
TEAM and of course TSLA
In sum the markets weak internals open the question of whether this is the immediate start of a corrective phase of if another immediate buy the dip will play out.
What these internals do signify is that when/if the SPX satisfies our 6100 + projection there will be divergences galore
The chips are the traditional leader and they are carving out a massive divergence.
They are in the same position as the SPX was in late August 2000.
This is the weekly 1 2 3 swing to a test of the highs.
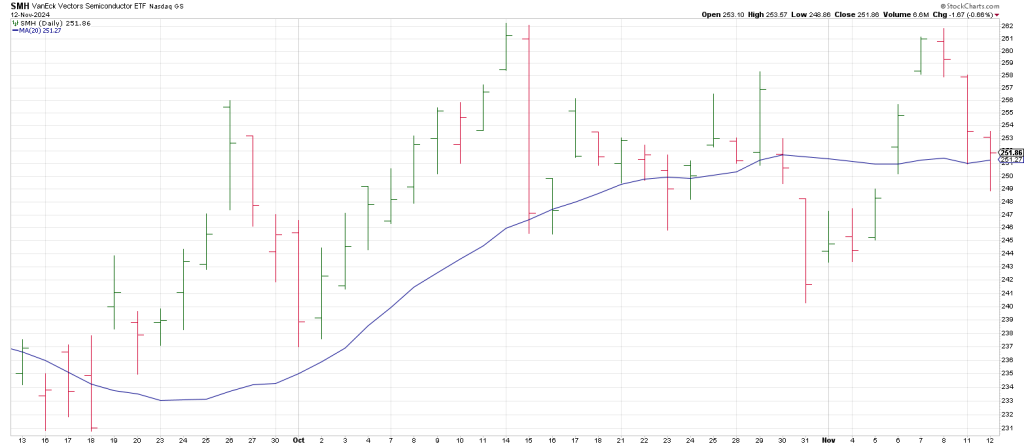
The same pattern is evident on the dailies.
SMH is at the downside pivot here having turned its 3 Day Chart down directly off last weeks high/
It held its 20 day ma but isn’t going anywhere unless it can convert the double top at the 261 region.
The Sq of 9 Wheel did a fantastic job of alerting us to risk in GLD at the 255 region.
GLD closed 2 days over 255 but then dropped with authority on October 31st leaving a 2 day Island Top.
A weekly GLD shows at the high it hit the top of a trend channel.
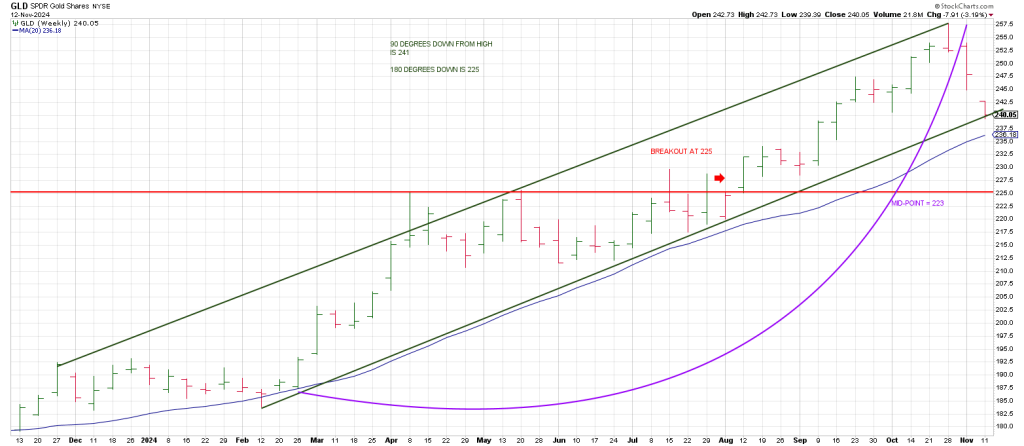
GLD has already struck the bottom of the trend channel.
90 degrees down from high is 241 here it is trading.
180 degrees down is 225,
This ties to the mid point of the range from the last impulse (purple arc).
Interestingly 22 ties to the last breakout in August.
Breakage below 240 opens the door to 223-225.