Over the years, Jeff has accurately predicted major market ebbs and flows. He’s been spot-on with everything from the crash of March 2020, to the meteoric rise in precious metals prices in 2024.
← Back to Powerful Market InsightsAs traders we can’t help but want to target shoot, to know where the market is going.
The Principle Of Squares is the best way I know to forecast price.
Be that as it may, in my experience these “forecasts” are best used as guides rather that predictions.
Think of it like a chess game. You want to observe how the pieces come together as the game progresses versus getting locked into an absolute expectation.
The market is like a chess game. The more pieces come together in the natural progression of time and price the more synergy sets up to be able to calculate an outcome with a strong edge.
Target shooting and building a roadmap are not the same.
A roadmap should have many signs pointing the way.
The reason I like to have a roadmap is so that price action doesn’t roll off me like water off a duck’s back.
When price action doesn’t play out in keeping with your roadmap it is the market telling you your probably wrong. And that’s something you want to hear.
Allow me to walk through my expectation of where the market is going.
From the 4104 October 27, 2023 low, the first rally high prior to a roughly 3 week consolidation occurred on December 20 when the SPX carved out a Key Reversal Day.
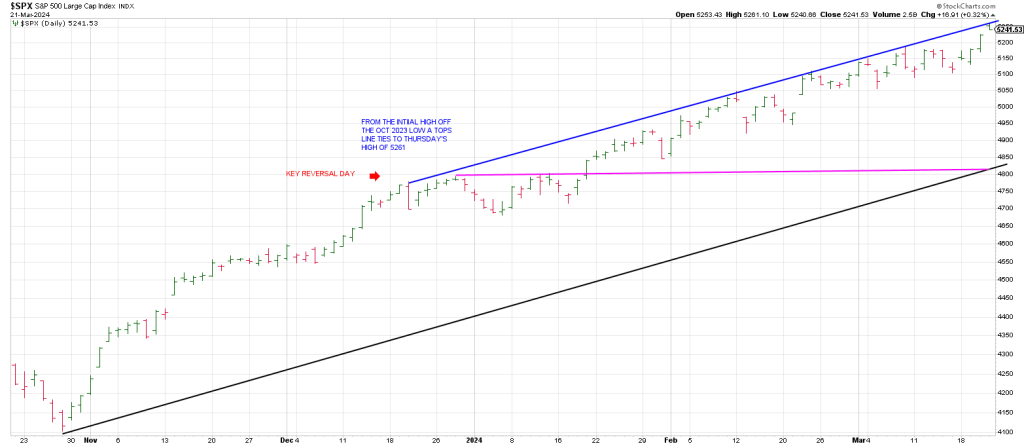
I created a Tops Line from the December 20th high that connected to highs throughout the first quarter.
That Tops Line tags Thursday’s high.
Interestingly we are apx 90 days/degrees from the December 20th Winter Solstice pivot high.
So Thursday’s 5261 high is important.
That said I think there is a strong likelihood we see an Overthrow of this Tops Line and 5261.
Here’s why.
Using the Principle of Squares, from the 4104 October 2023 low, 1 cube out higher is 4407.
2 cube-outs higher is 4908.
3 cube-outs is 5337.
Checking the Square of 9 Wheel shows that 533 conjuncts/aligns with October 27th, the low day and is straight across and opposite April 24th.
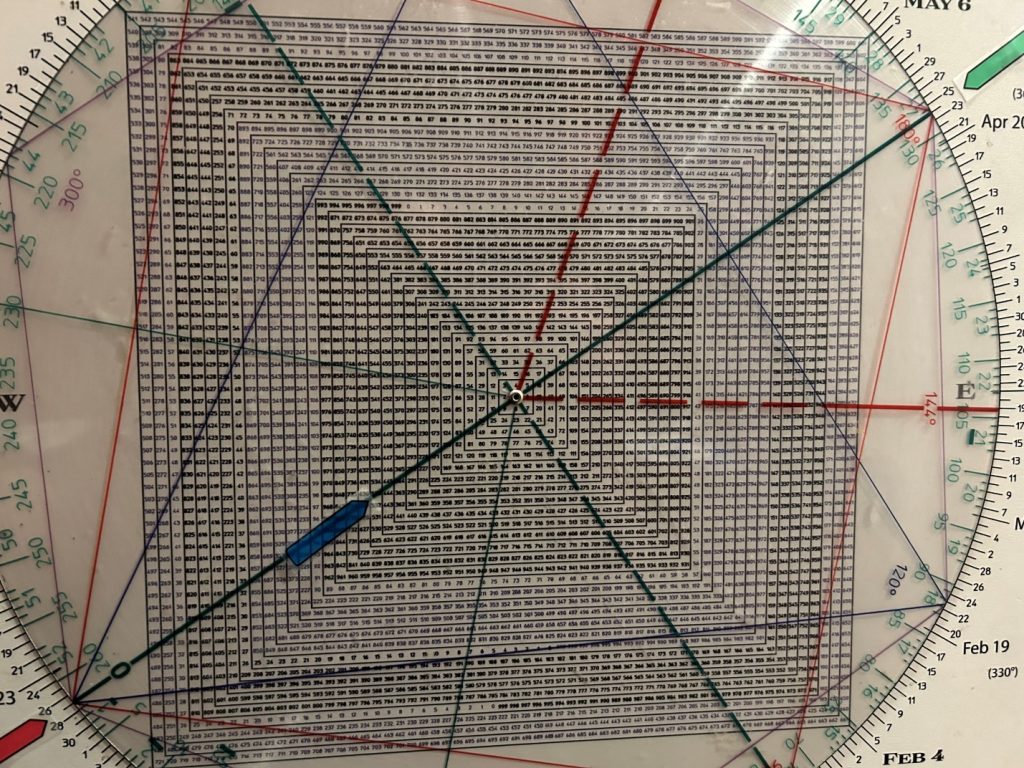
By the same token, 537 (5370) is opposition April 8th the date of a powerful solar eclipse, the second Great American Eclipse.
If the market really wants to stand on its heels, it is worth noting that 561 squares the April 8 eclipse
And that 557 squares the October 27 low.
This 5500 to 5600 range is interesting to me because 55-56 calendar days is the end of Gann’s Panic Window.
This where many great crashes have culminated counting from their high day.
This includes the 1929 and 1987 Big Kahuna’s.
557 also squares-out with the important late July 2023 high.
Going a little deeper down the rabbit hole, we see that 386, the DJIA high in 1929, aligns with 559.
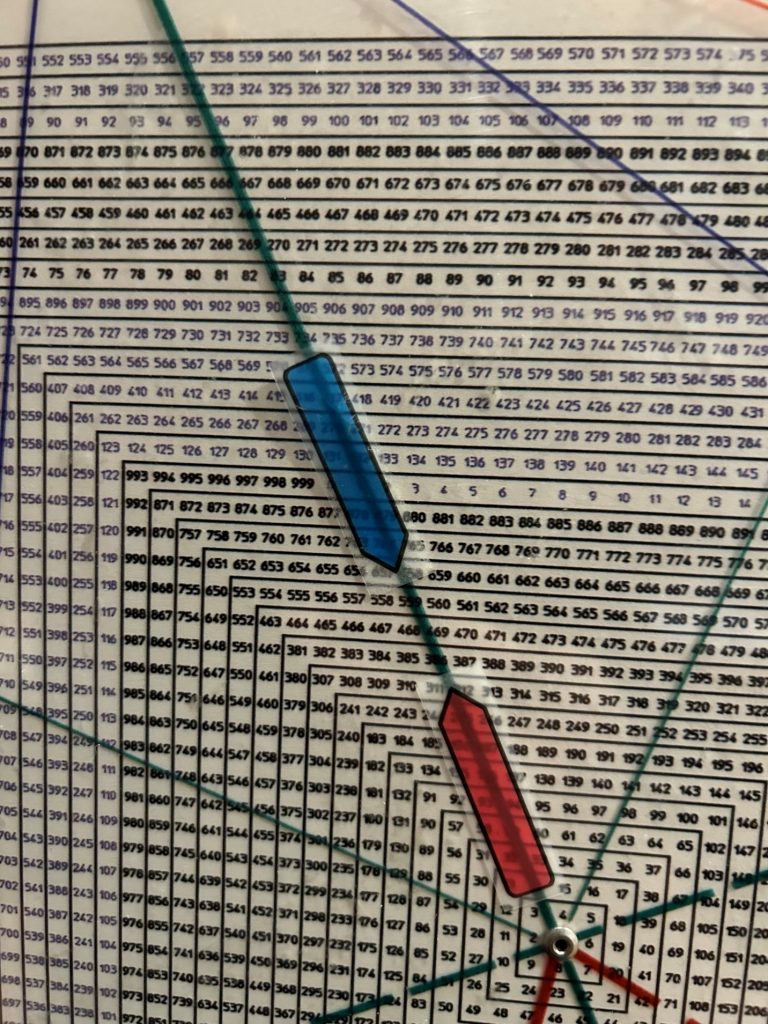
I’m mentioned that there is a lot of synchronicity with 1929 in 2024 so it is pertinent to measure from the 1929 price high.
As well as you may recall this April is 94.5 years from the early September 1929 top.
94.5 squares-out with April 8, the eclipse.
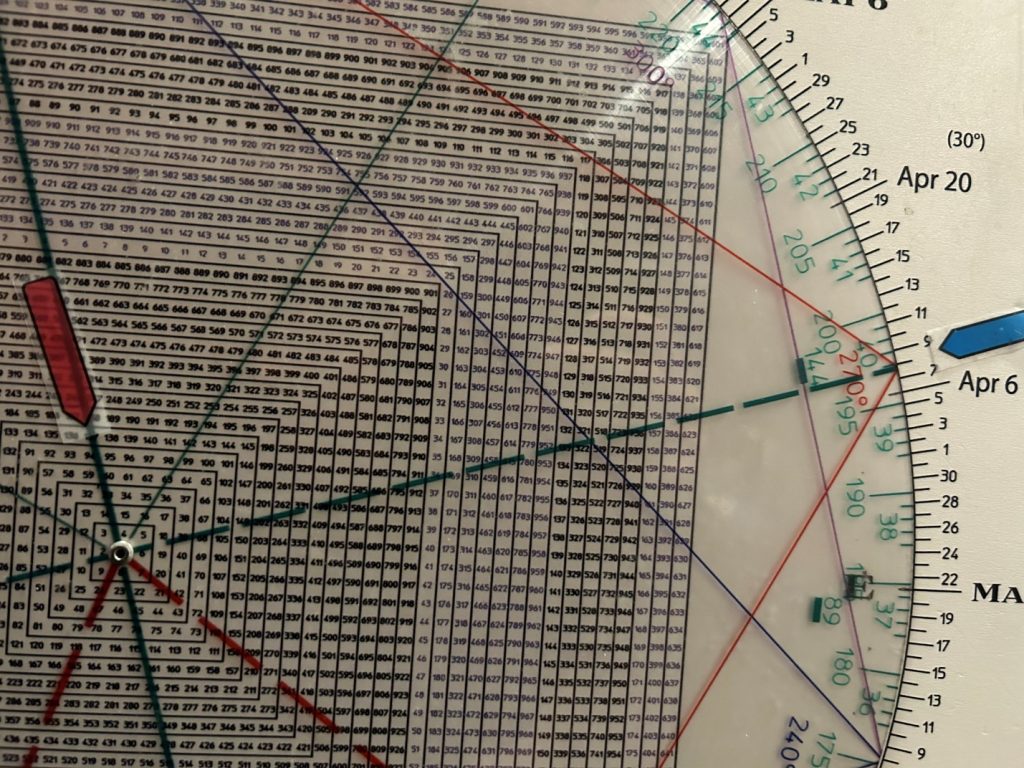
If this weeks breakout over the key 5190-5220 region extends next week we could overthrow the Tops Line in the above daily SPX with a Buying Climax to at least the 5330’s with a shot of 5500-5600.
Are these carved in stone? Of course not. Speculation is observation, pure and experiential.
We want to observe the price action in this important time frame day by day.
If you’re a bear, you want to see the market ramp.
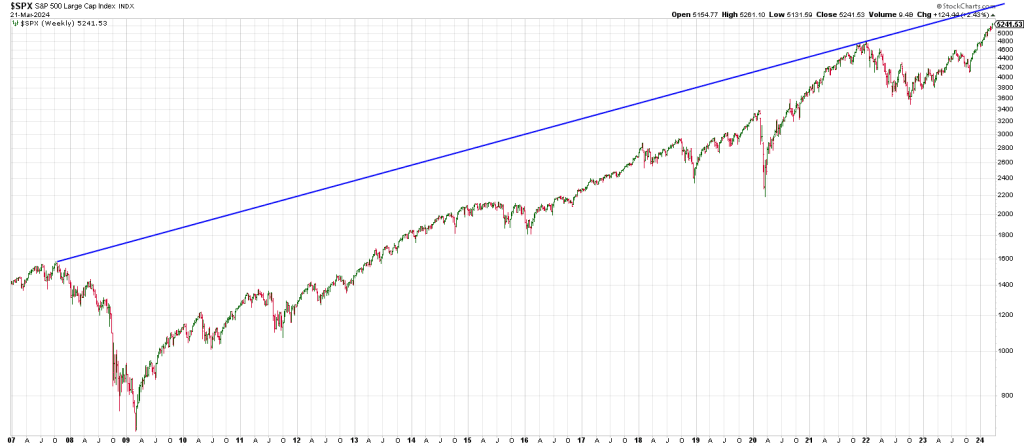
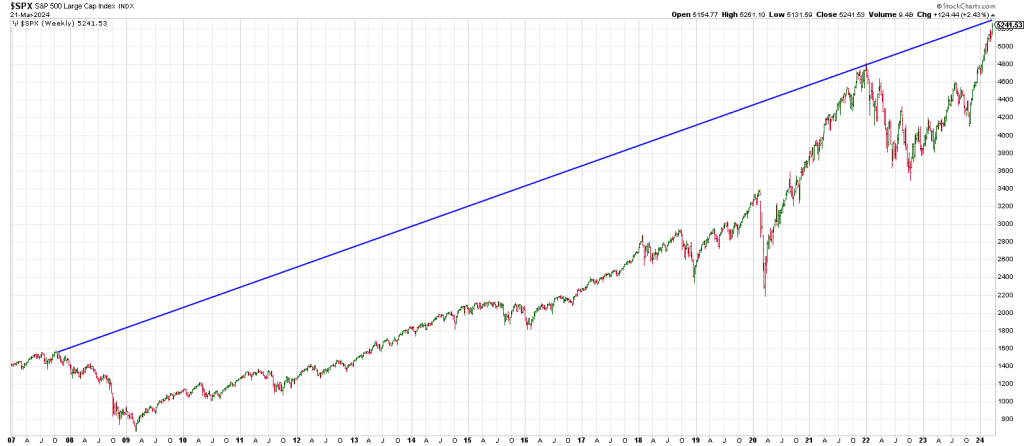
The two biggest tops this century are March 2000, October 2007 and January 2022.
Connecting the 2007 top with the January 2022 top gives a Tops Line that ties to the aforementioned 5300-5600 region.
Below are a logarithmic and arithmetic depiction suggesting the market has room to run…whether it hits its head on 5330 or shoots the moon to 5500-5600.
