“There’s a place where you are goin’
You ain’t never been before.” Lost Cause, Beck
Ever since the 1987 crash and Black Monday when Greenspan created the Fed Put, market participants have suckled at the breast of the Buy The Dip Lady.
The market taught traders to buy the crash in 1987 and 2020 fostering a generation of passive mechanical approach the market.
Even the longer term cyclical bears were limited —time-wise—to 2 to 3 years in the 2000-2002 episode and in the 2008 crisis.
At some point the market is going to disabuse players of this posture.
And we will get a top that last a decade or more by virtue of a decline so deep that even 100% rallies don’t get back to Mount Olympus.
The question is of course is that big picture top of tops, that mountain behind us?
People produce a lot of charts showing trend lines that spell catastrophe and produce narratives that discuss the why and the what.
Please spare us and tell us The When.
Time is trickster.
As W.D. Gann stated. “Time turns trend.” He did not say Price turns trend.
Despite the well-worn bromide on the Street that “only price pays.”
So when is the point of no return.
We have been saying throughout 2024 that the ghost of 1929 was going to haunt the tape.
That was a Super Cycle Top.
A Super Cycle Top of a greater degree may be on the table.
It is debatable whether there is “one more good high” or whether 5 waves of many degrees culminated this past July.
Be that as it may the SPX tested the July high which may have been a Secondary Top.
It did so at an important anniversary: the anniversary of the 1987 top, the 1929 top and the 2000 Secondary Top.
Last week we showed how the year 1929 squared out with late August on the Square of 9 Time/Price Calculator.
The year 1987 is opposition August 1st when we got a Flash Crash. Was it a Four-Shadow?
Often 4 weeks or a month before a significant turning point, the market will telegraph a turn.
The ancients told time by the “moonth” and W.D. Gann said the Monthly Swing Chart determines the big picture trend.
The SPX July signal reversal bar remains the high after having been tested with a large “tail” bar in August….after the Monthly Swing Chart turned down.
This was the first turn down in the SPX monthlies since April 2024.
That turn down defined an immediate low on the monthly swing chart.
As you can see in August the SPX slid considerably lower after the turndown.
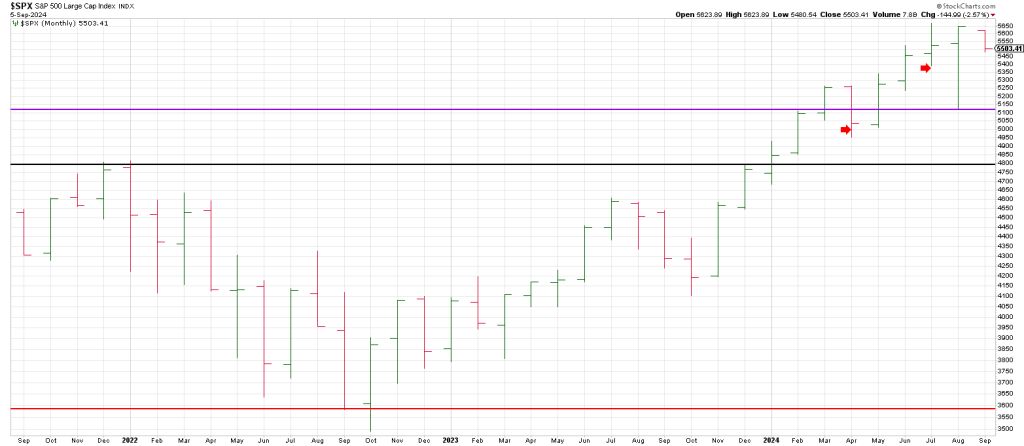
The point of recognition is 5390.95. That is the level where the monthlies turned down in August.
Mr. Market has a well-developed memory.
Interestingly 360 degrees down from the ATH is 5373 which ties closely to the aforementioned 5390 where the monthly turned down in August.
Below this pivot opens the door to a test of the January 2022 top at 4800
Breaking August’s “tail”—in other words trade below the August low in the 5100 region will break the back of the bull.
Again, many charts point to an “ultimate” projection, but time trumps price.
When trumps where.
A big picture chart I came across underpins the idea that I have been thinking that 2024 is a test of the 2022 top.
In other words 2022 may have been an A Wave decline followed by a B wave advance into the summer of 2024.
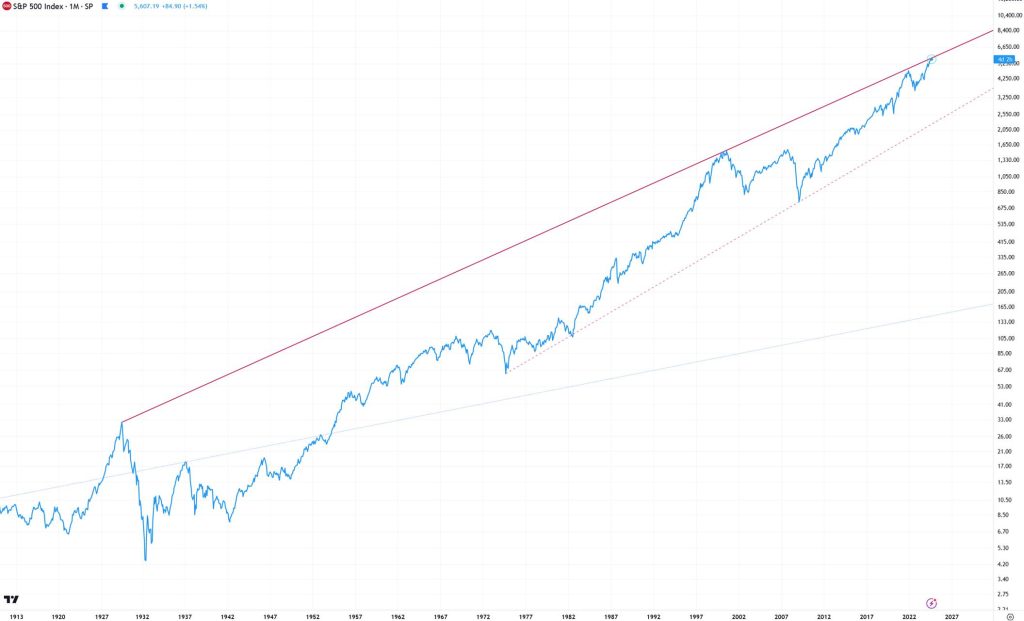
Notice the Bottoms Line from the 1974 low that ties to the 3500 region at the 2022 low.
But there is a trend line not show that connects the lows from 2009.
That trend line resides in the region of the closing lows from this past August or 5200 ish.
Below the October 2022 low is all air. It is the Mother of Rule of 4 sell signals (break of a 3 point trendline).
But WHEN does the slide start?
There is reason to believe it is this fall (September), with a bounce and then the Abyss starting in Q 1, 2025.
Why the Fall of 2024.
The Jubilee Cycle of 50 years.
This is the 50 year (600 months) anniversary of the October low in 1974…just as the August 1982 major low was the anniversary of the major low in the summer of 1932.
50 years before 1974 was 1924 which was the start of the 5 year Roaring Twenties Bull.
There is another Panic Cycle that points to the current time frame that we have discussed in recent reports.
The Panic of 1907. That was 117 years ago.
On the Square of 9 Wheel 117 squares-out with September 11-13.
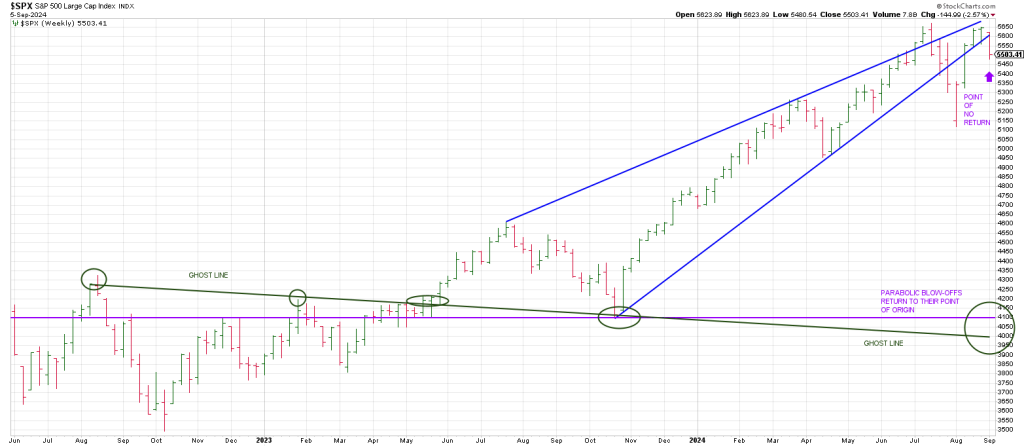
In sum a Rising Wedge from the blow-off that started in October 2023 has been snapped….and backtested.
This looks like the near term point of no return.
Below the August “tail” opens the door to the 4000 region.