A daily Plus One/Minus Two buy setup occurs when the 3 Day Chart is pointing up and then you get 2 consecutive lower daily lows.
The 3 Day Chart turns up when you get 3 consecutive higher daily highs.
The important thing to remember is that we’re not talking about closes, just higher highs.
Same goes for the 2 consecutive lower lows…these are just lower daily lows (all though they may also be 2 lower closes).
So the Plus One equates to the 3 Day Chart pointing up.
The Minus Two equates to the 2 consecutive lower lows.
Anytime the 3 Day Chart is pointing up and you get 2 consecutive lower daily lows the item is
IN THE BUY POSITION.
The setup is triggered on trade above the prior day’s high.
However, often times when the item is ‘in the position’ a upside reversal will occur the same day and often a gap up will occur the next day.
The opposite of the Plus One/Minus Two buy setup is the Minus One/Plus Two sell setup.
In this case the 3 Day Chart is pointing down (Minus One) and two consecutive higher daily highs satisfies the criteria.
These setups play out on all time frames, hourlies, dailies, weeklies and monthlies.
Let’s take a look at a few examples.
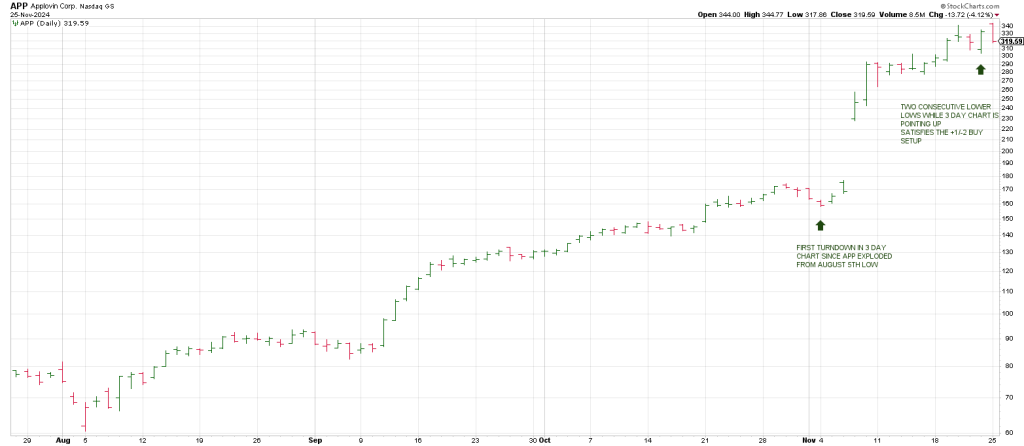
APP turned its 3 Day Chart down for the first time in early November.
I am pointing this out because it is the first time this occurred in months.
The first time a stock does something, take notice.
Following the turn down, you get two consecutive higher highs …but this is directly before earnings.
This is a theoretical daily -1/+2 sell but not one to take in practice because the trend is powerful and as offered APP had just turned its 3 Day Chart down for the first time.
Moving forward you can see that last Friday APP carved out two consecutive lower daily lows putting it in the Plus One/Minus Two buy POSITION.
As soon as the criteria were satisfied, APP exploeded leaving an outside up day.
The next chart shows ORCL’s Plus One/Minus Two buy setup in mid-November.
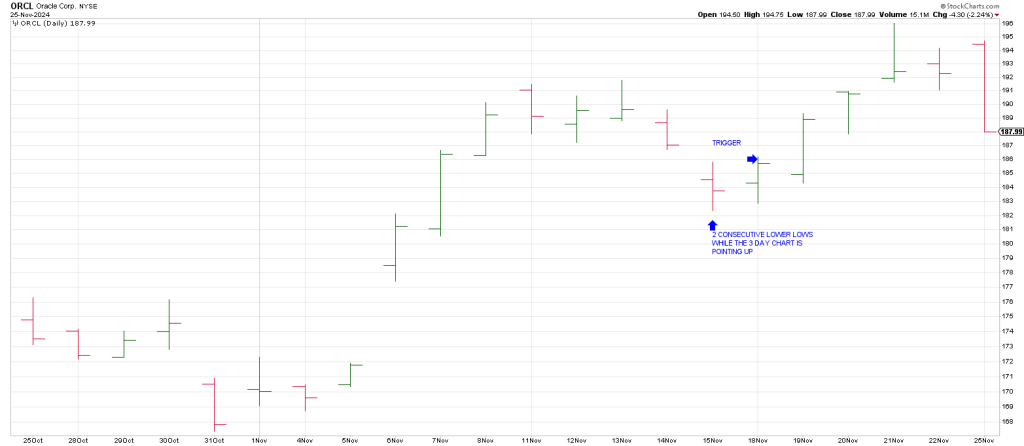
Notice that the next day following the setup was a Throwaway Day.
However the next day, ORCL “came out” and continued to rally powerfully,
In sum once the setup was triggered ORCL rallied 10 points in 3 days.
LULU is a good example of a weekly Minus One/Plus Two sell setup in March 2024 as it was coming off record highs.
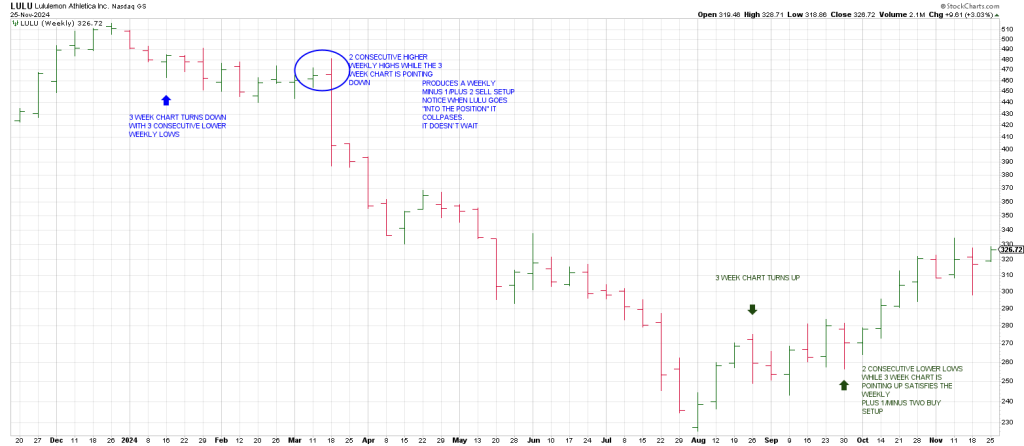
Notice that as soon as it went into the sell position it water-falled.
Moving forward to August, LULU turned its 3 Week Chart up for the first time since high.
It traced out 2 consecutive lower weekly lows in late September which perpetuated a 60 point rally phase.
Let’s look at a TSLA weekly
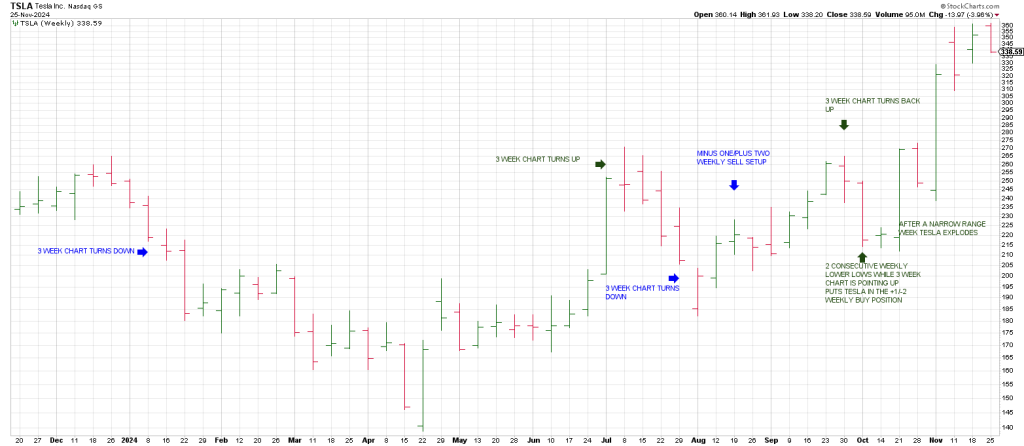
TSLA is a good example of how the 3 Week Chart in and of itself does a good job of determining the trend.
In August TSLA satisfied a Minus One/Plus Two sell setup.
Notably it barely dropped.
This was a tell for the rally that was on deck.
Speculation is observation of behavior.
Notice that TSLA’s 3 Week Chart turned upin late September followed by 2 consecutive lower weekly lows for a Weekly Plus One/Minus Two buy setup.
The next week was a narrow range week…a Pause Week.
Subsequently TSLA exploded.
Here’s something important: there is one other way the 3 Period Chart can turn up other than 3 consecutive higher bars.
It can do so by rallying over a prior CIRCLED 3 Week Chart high.
Circled means the last high 3 Week Chart high.
Ditto for the 3 Week Chart turning down.
TEAM is a name that Hit and Run members did very well on when it exploded after reporting on November 1st
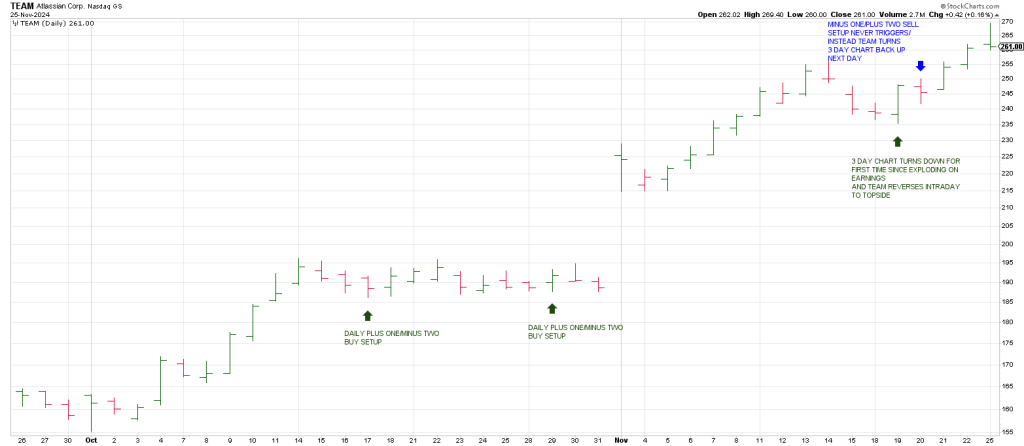
Notice that during the time TEAM was in a Line Formation prior to earnings, it carved out two Plus One/Minus Two Buy setups.
TEAM turned its 3 Day Chart down for the first time since exploding on November 19th and immediately reversed to the topside leaving an outside up day.
Theoretically the next day was a Minus One/Plus Two sell setup.
But again this is not a good one to take because TEAM is in the middle of a powerful rally on the heels of a strong report.
The +1/-2 buy pattern did a great job of positioning Hit and Run several times in GLD this year.
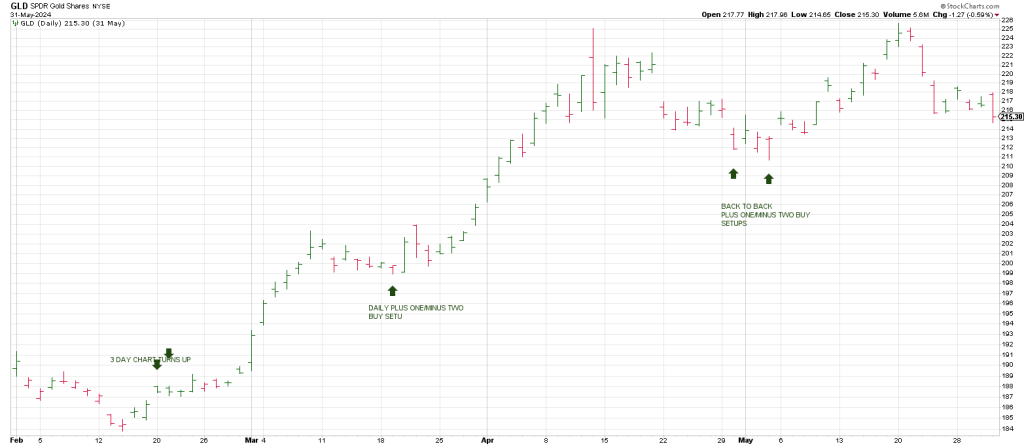
The 3 Day Chart turned up in February.
There is actually a +1/-2 buy setup on February 22nd (not shown).
GLD exploded.
There is another Plus One/Minus Two buy setup on March 19th just before a stunning 25 point run (apx $250 in gold) in 3 WEEKS!
In late April/early May GLD left back to back +1/-2 buy setups before another run.
Below is a daily FSLR
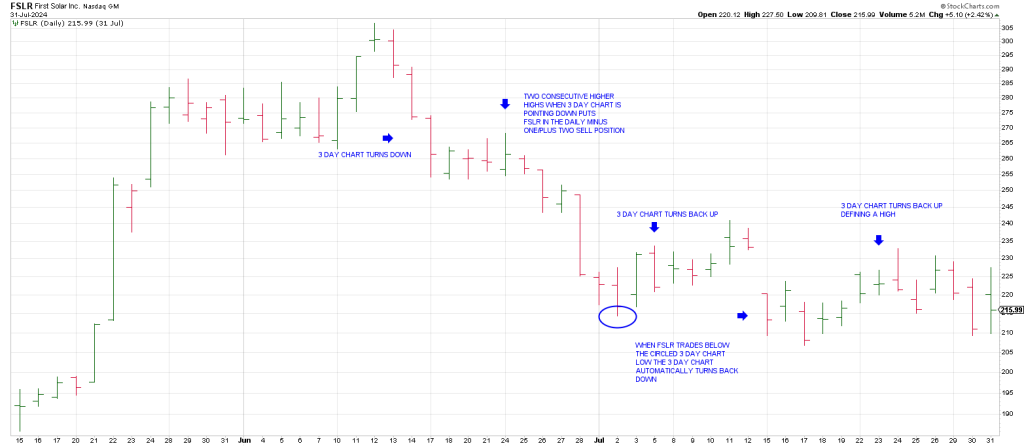
FSLR has been in a persistent downtrend since June.
notice how the 3 Week Chart turned down directly off the June peak and FSLR could not stage a rally.
It went into the daily Minus One/Plus Two sell positon in late June when it traced out 2 consecutive higher weekly highs with the 3 Day Chart pointing down.
FSLR collapsed from the setup.
It turned its 3 Day Chart back up on July 5th which basically defined a high.
The 3 Day Chart turned back up in late July again defining a high soon in terms of time and price.
Let’s look at an index…the QQQ.
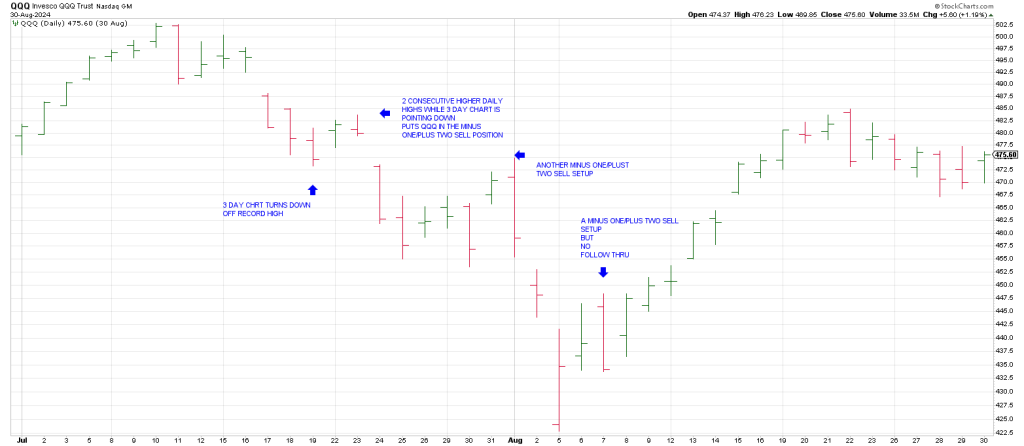
The Q’s 3 Day Chart turned own in late July followed immediately by two little higher daily highs satisfying the criterial for a daily Minus One/Plus Two sell setup.
The Q’s gapped down the next day and plunged into August 5th.
Both signals produced big gains in puts for Hit and Run.
Going forward you can see that subsequent to the August 5th Flash Crash low, QQQ carved out a Minus One/Plus Two sell setup.
It paid off the day of the setup if you scalped it, but there was no downside follow thru.
Instead, when the Q’s offset the August 7th outside down reversal, a Keyser Soze buy signal was given…a Reversal of a Reversal.
This was the tell that a larger rally was on deck.
CRWD left a Monthly Plus One/Minus Two buy setup at the August low.
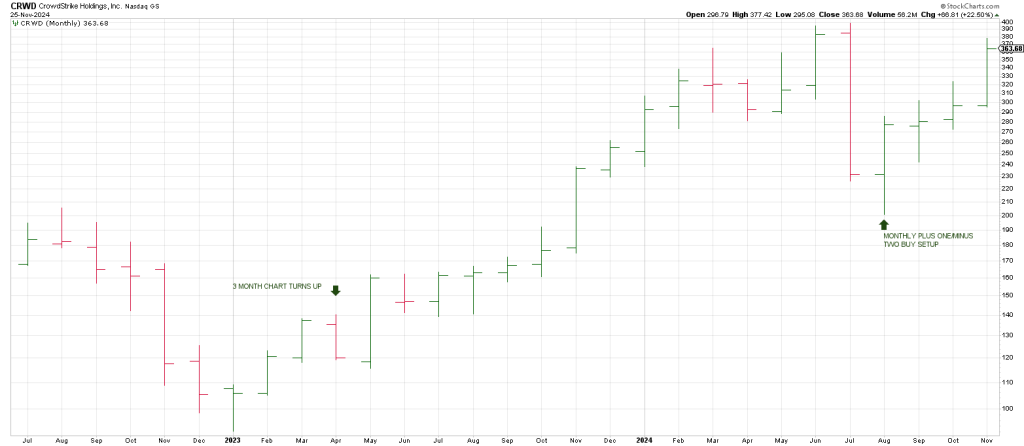
The 3 Month Chart was up and CRWD traced out two consecutive lower monthly lows.
Boom. Back to the highs over the next 3 months.
Amazing.
ANF is a great example of the benefit of my Swing Methodology.
ANF is in a strong uptrend in July 2023 when it produces a weekly Plus One/Minus Two buy setup.
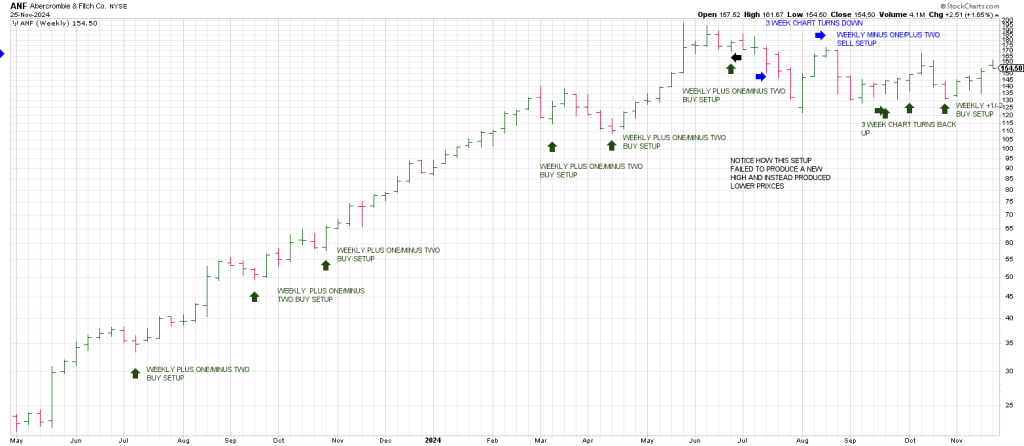
Another advance plays out.
ANF carves out another Weekly Plus One /Minus Two buy in mid September 2023.
Another surge plays out.
ANF leaves yet another weekly Plus One/Minus Two buy setup in late October 2023 …just before it goes into orbit.
Notice that in March 2024 a Plus One/Minus Two occurs but it doesn’t elicit a meaningful rally.
However, another weekly Plus One/Minus Two occurs in April that works well.
I take this to imply that ANF traced out an A B C correction before continuing its advance.
After the June peak, ANF delivers another Plus One/Minus Two buy setup.
Notice how this setup failed to produce fa new high and instead produced lower prices.
In fact the 3 Week Chart turned down. It finally turned back up the week of October 7th.
Subsequently ANF produced 2 consecutive lower weekly lows for a weekly +1/-2 buy on the week of Oct 28th.
ANF has rallied 30 points since.
Lastly let’s take a look at AMD and weekly sell signals.
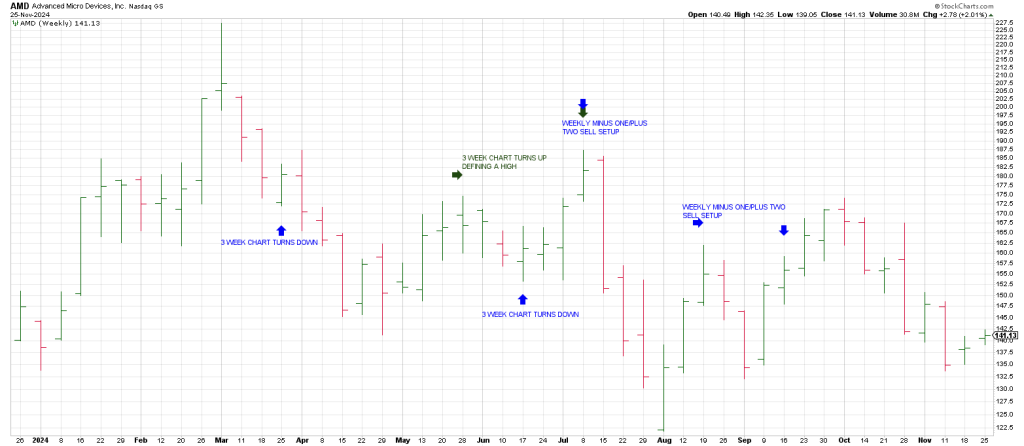
AMD turns its 3 Week Chart down right off the peak. Typically not a good sign.
The 3 Week Chart turned back up in May defining a high.
It turned back down in mid-June.
AMD consequently went on to make two consecutive higher weekly highs while the 3 Week Chart was pointing down.
This was mid-July.
Another weekly -1/+2 sell setup played out from the week of mid-August.
Finally AMD’s 3 Week Chart turned back up in late September defining a high.
The 3 Week Chart turned back down on the week of October 28th and it remains pointing down.
In sum, we use these same patterns on the hourlies and dailies to trade off the Hit and Run Private Twitter Feed.
It forms the heart and soul of the Hit and Run Swing Method.
This multiple time frame analysis of these charts does a good job of revealing the three trends running simultaneously: the minor, the intermediate and the major.
Nothing is guaranteed in markets, but this Swing Methodology is powerful and when combined with my Square of 9 Time/Price Calculator the odds are stacked in our favor.

Square of 9 Wheel
Purchase your own Square of 9 Wheel. Shipping to US only. Contact Jeff for shipping outside the US.