“What we do know is that speculative episodes never come gently to an end. The wise, though for most the improbable, course is to assume the worst.” John Kenneth Galbraith
On Monday, May 12, 2025, the SPX surged by 3.26%, closing at 5844. Following a reduction in the trade war escalation between the two biggest economies on the planet.
There was no ‘deal’ per se. Tariffs were reduced for 90 days in an effort to reach a deal.
Be that as it may this development led to a broad market rally with stocks posting substantial gains.
However, it’s important to contextualize such single-day advances within historical market patterns.
The SPX exploded 3.26%.
Historically many of the most significant one-day gains in the SPX have occurred during bear markets,
For example:
2002 Bear Market:
- July 24: +5.73%
- July 29: +5.41%
- October 15: +3.95%
- October 11: +3.90%
2008 Financial Crisis:
- October 13: +11.6%
- October 28: +10.8%
- November 13: +6.9%
- October 20: +4.8%
- October 16: +4.3%
- December 16: +4.5%
Obviously, my stance was leaning into the short side.
I was not expecting a Pause to cause such an explosive rally.
I was not expecting what is essentially a “kick the can” down the road agreement to continue talks to produce exuberance.
I can’t help wonder if there aren’t some smart folks out there who have learned how to game the Algomatics and get everyone on the same side of the boat just as a wave hits washing players over the side.
The SPX has traded up 1000 points and we’re just now above the 200 DMA?
I’m going to keep it brief.
What I love about the markets is that it’s like a 3 dimensional chess game married to a crossword puzzle.
By that I mean that the game is ever evolving as each move takes place.
George Soros called it his Theory of Reflexivity wherein investors’ perceptions of reality influence economic outcomes, and these outcomes in turn affect investor’s perceptions creating a feedback loop.
The theory suggests that market participants don’t necessarily base their decisions on objective reality but rather on their subjective views which can produce a reality that is divergent, a deviation from price equilibrium.
In other words what is being viewed affects the outcome of that which is being viewed.
Subjective perceptions drive investment decisions which in turn impact the underlying fundamentals themselves, such as price or interest rates.
Allow me to explain. The market is like the poker game, Texas Hold’em where we learn more about the possible outcome as the cards are drawn on The Flop, The Turn and The River card…the fifth and final ‘community’ card dealt.
Of course the reactions and gamesmanship of the players as these cards are revealed change the outcome.
I say this because, with each twist and turn of the market we glean more information to evaluate the crossword puzzle.
In sum, my expectation was that 5720 SPX would prove to be meaningful resistance.
And while the 5700 region did put a lid on the market for 6 days, on the 7th it erupted.
With the gap over the 200 DMA it “looks like” blue sky ahead, right?
No so fast.
3 ½ squares up from the 4835 low is 5837.
Why is 3 ½ full squares important?
1 full square is 360 degrees
2 full squares is 720 degrees
3 full squares is 1080 degrees (2 cubes)
Adding another ½ square of 180 degrees = 1260 degrees.
1080 + 180 = 1260 degrees.
Why is this important?
1260 degrees is the Biblical “time, times, and half time”
Time is 360 degrees
Times is 720 degrees
And half time is 180 degrees for 1260 degrees.
Monday we got a gap up above the 200 DMA.
The last time the SPX pushed above its 200 DMA was on March 24th.
This was just before the selling panic into April 7th.
The SPX declined from 5787 to 4835 … almost 1000 points.
Now the SPX has rallied 1013 points.
My point is this 5837 region marks an important inflection point.
At the same time, as offered yesterday this week is an important week…and the market has run hard into this time and price.
Why is this week important?
First it is anniversary of the NYSE started on May 17, 1792.
This 233 years ago.
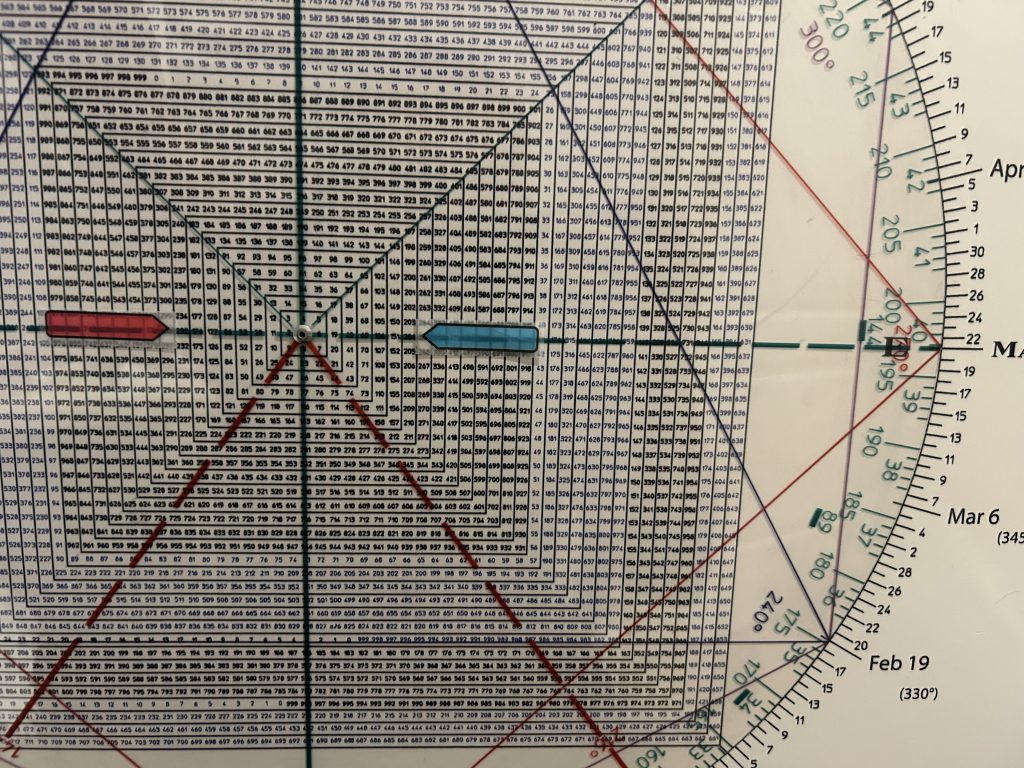
233 is an important number because it falls on what is called the Cardinal Cross on the Sq of 9.
That is all the numbers due north/south and east/west.
All numbers on the “Cross” are considered exalted, more powerful.
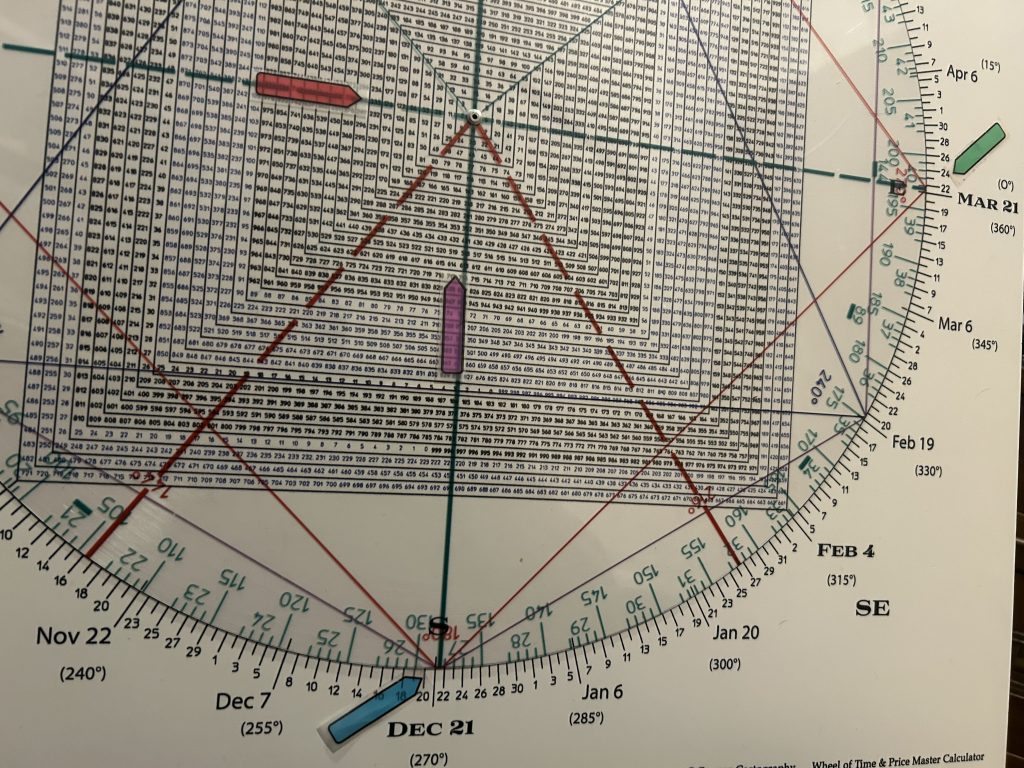
Notice that 233 points to W D Gann’s “Zero Point”, the Vernal Equinox, March 21-23.
233 also squares-out with 613 which ties to the all-time SPX high of 614 (6147).
As well 233 squares-out with December 21st, which 5 years ago was a very powerful Jupiter/Saturn conjunction.
If you check the major degrees forwards and backwards from this Dec 21st, 2020 Great Conjunction you will find many good turning points.
For example the Covid Crash low was 270 days/degrees prior.
The Dec top in 2021 was 360 degrees later (we had a top in Nov and Jan…Dec split the difference).
This week is the anniversary of the rally high in May 2008 prior to the Lehman Crash.
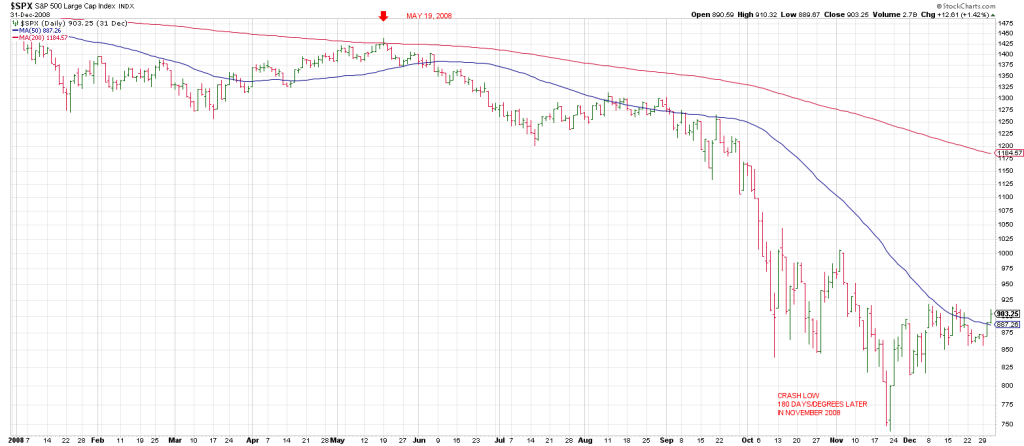
After the Bear Steans debacle in March 2008 the market rallied hard—the SPX advanced from 1257 to 1440. In 8 weeks.
I remember it well. The Street was convinced the worst was behind.
It was just ahead.
This feels like an echo of position of the market today.
The abyss has been averted. Right?
May 2008 was 17 years or 204 months ago.
Remarkably 204 is on the Cardinal Cross aligning with 233.
So we have a vibration between the NYSE and the pre-crash high in 2008 and this week.
I am not an astrologer, but a friend of mine is a renowned astrologer and has this to say before I mentioned anything:
“the cosmic weather id due produce dramatic alterations in markets. The Sun and Uranus have annual alignment but this Friday triggers major points in President Trump’s chart. While he is known for outrageous statements, this week could exceed even his personal best.
Simultaneously, the NYSE celebrates its birthday. It’s solar return chart is UNLIKE ANY PREVIOUS one with Uranus (shocks and surprises) exactly on its solar position.
In sum, the presumption is for a trend change and unexpected turbulence
It will be the nature of any pullback—whether it is impulsive or corrective that will tell us much about the complexion of the market.