“Try to catch the deluge in a paper cup.” Don’t Dream It’s Over, Crowded House
NVDA reported after the bell last Wednesday.
They beat Wall Street’s expectations for revenue and earnings per share and they provided strong guidance.
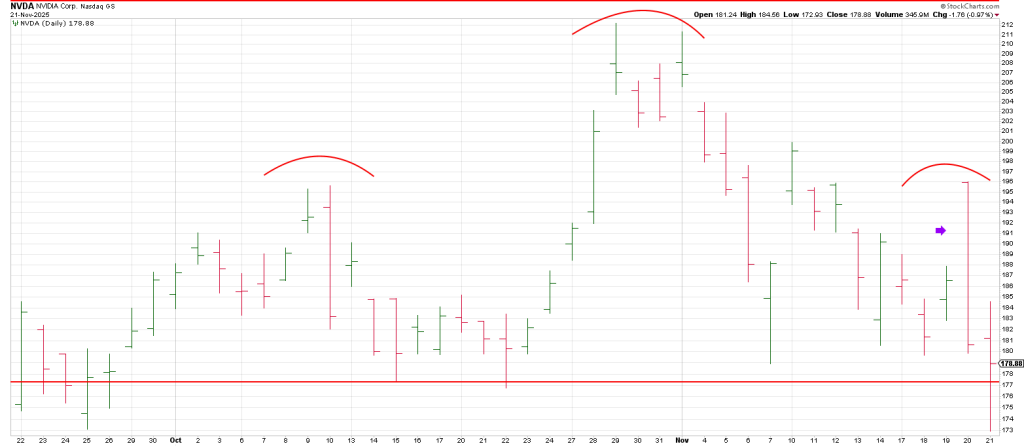
The stock exploded from 186 to 196 which we had defined the day before as strong resistance and a possible Right Shoulder of a Head and Shoulders top.
Then it collapsed.
What’s going on?
Seldom if ever have I seen a Right Shoulder produce such an immediate thrashing.
It was a reversal for the ages.
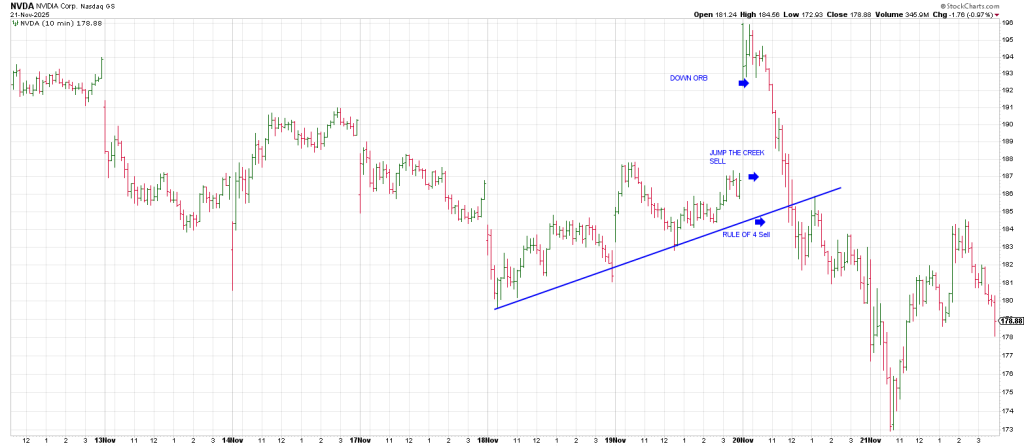
Drilling down to a 10 min chart shows just how stunning and rapid the reversal was.
It was as if Jensen took a lie detector test Thursday morning and the results stunk up the joint?
Be that as it may, when NVDA triggered an Opening Range Break (ORB) to the downside on Thursday, and followed though, it was talking dirty.
When it offset the up gap it triggered a Jump The Creek sell signal.
As it that wasn’t enough, the bear mauled NVDA’s last short-term support when it broke a short term Bottoms Line at the 185 region.
Remarkably, NVDA dove to its lowest point in a month on a day when it reported supposedly stellar earnings.
What’s going on?
Was it orchestrated with longs selling into the spike planned weeks before.
Was it a an ambush perpetuated by shorts?
Either way it was Rug Pull unlike any I can recall as it’s the largest company in the world.
It dragged down anything AI related.
For example AMD plunged from 234 to 204 on Thursday.
NVDA dove below its Neck Line on Friday and rebounded to essentially close “on the line”.
The question is does it have a noose around it’s “Neck” or was Thursday/Friday a potentially bullish Undercut/Flush-Out?
I think there is a strong argument that the price action speaks to the negative cycle NVDA is in.
It topped on October 29 leaving both Gilligan and Lizard sell signals.
A Gilligan is a strategy I developed to identify possible buying climaxes.
It is a gap up to a new 60 day high with a close at/near session lows.
A Lizard is strategy I developed to identify near term changes in trend.
It is a new 10 day high with the open and close near session lows following a run up earlier in the day.
NVDA tested its Oct 29 high 3 day later followed by a Breakaway Gap on November 4.
Notice the series of distribution or sell days since Oct 29.
In fact NVDA traded above a prior day’s high only 3 times since the Nov 4 Breakaway Gap prior to last Wednesday’s Earning’s Reversal.
Each turn up on the dailies defined a high.
In sum, someone has been selling into strength.
So it should have been no surprise that “they” took advantage of Wednesday’s opening spike.
Last Monday, a filing showed tech billionaire Peter Thiel’s hedge fund had sold its entire stake in NVDA over the prior three months.
That disclosure came just 3 days before NVDA’s earnings.
Thiel’s revelation was on the heels of an announcement days earlier that SoftBank had sold all of its NVDA holdings.
These investors weren’t trimming they sold all shares in NVDA.
What do they know?
Is Jensen’s creative accounting too good to be true?
What spooked investors on Thursday’s reversal was that there was nothing to wrap their head around.
So Wall Street did what Wall Street does best: sells first and asks questions later.
The rationalizations are being wheeled out by the talking heads to explain the move:
“The numbers weren’t quite as sensational as they looked at the initial blush”
“Creative accounting concerns”
“Anyone that wanted to buy had bought. It was All In on AI”
They miss the point. In a bull market poor earnings barely faze stocks.
In a bear market, good earnings often do not produce more than fleeing upticks.
This is analogous to the behavior of the 3 Day Chart and 3 Week Chart which we use to determine the short term and intermediate term trend respectively.
In a bull market a turn down in the 3 Day Chart and the 3 Week Chart define a low soon in terms of both time and price.
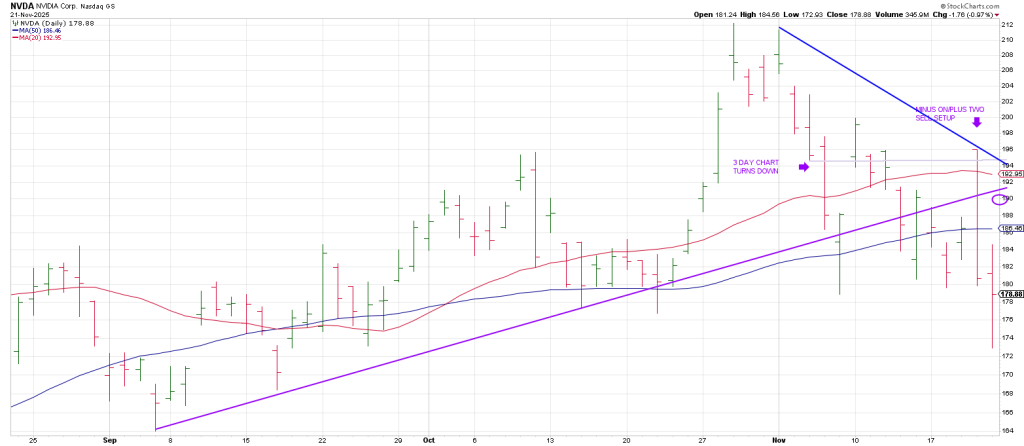
NVDA turned its 3 Day Chart down on November 6. It continued lower. The Sign of the Bear—a least in the short-term
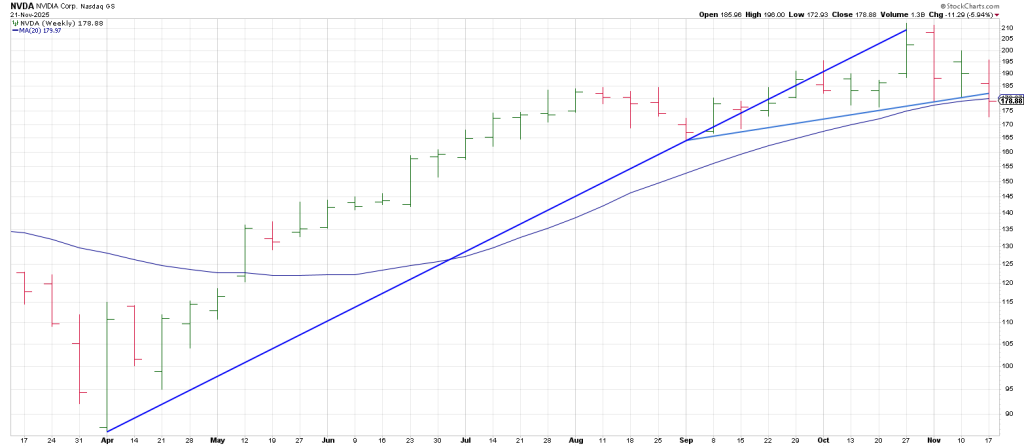
NVDA has not turned its 3 Week Chat down since the April low.
It currently shows 1 weekly lower low (intraweek NOT closes) which means if it’s going to turn its 3 Week chart down the soonest it could do so is in 3 Weeks.
NVDA peaked at 212 on Oct 29.
212 squares Oct 29 on the Sq of 9 Wheel.
360 degrees down is 158 by definition also squares Oct 29.
NVDA is likely on a trajectory to 158 near its 200 DMA.
Checking the QQQ shows it turned its 3 Week Chart down last week.
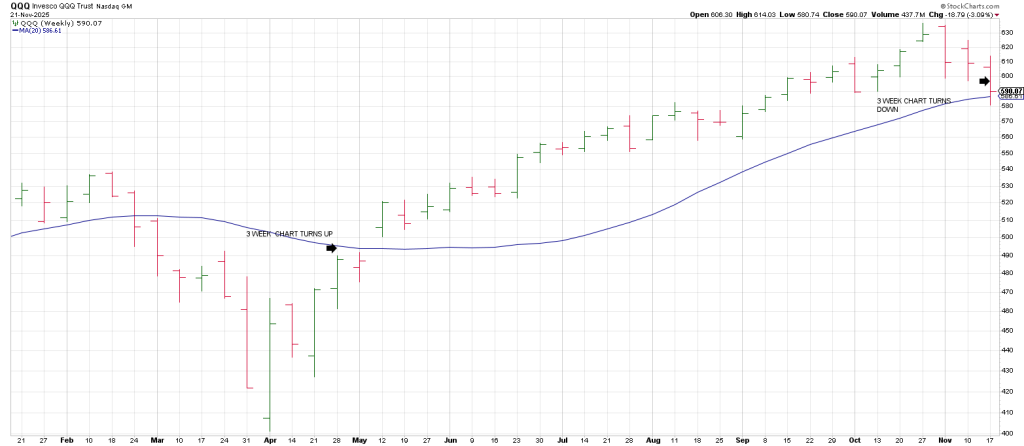
Last week the Q’s also tested their 20 week moving average for the first time since the advance unfolded.
Typically these two factors would create a significant low in a bull market.
Even at the onset of a bear market, if that’s what is playing out, one or both of these technical would produce a counter-trend knee-jerk rally.
In sum, when the DJIA struck a new high on a 3 Day Spike on November 12, the vast majority of market watchers paid little attention to the failure of the Q’s or the SPX to follow suit.
Months and years from now I suspect the divergence will be seen as the bell that isn’t supposed to ring at the top.
It is going to be harder for the Street to ignore the Quasimodo price action with NVDA’s Earning’s Reversal.
Friday saw a strong surge in breadth in tandem with the Fear/Greed Index at/near April’s levels.
This is occurring with the SPX testing key support.
The caveat for the moment is that it occurred on a weekly OpEx which may have produced a one day spike.
December will clarify a lot. There is a lot of synergistic time/price potential in December that ties to the 349 (3490) October 2022 low and the 219 (2190) March 2020 crash low.
In addition the 692 (6920) SPX all-time high resonates off mid-December.
We will explore and expand on each of these factors that cluster in December in tomorrow’s report.
You don’t want to miss it.

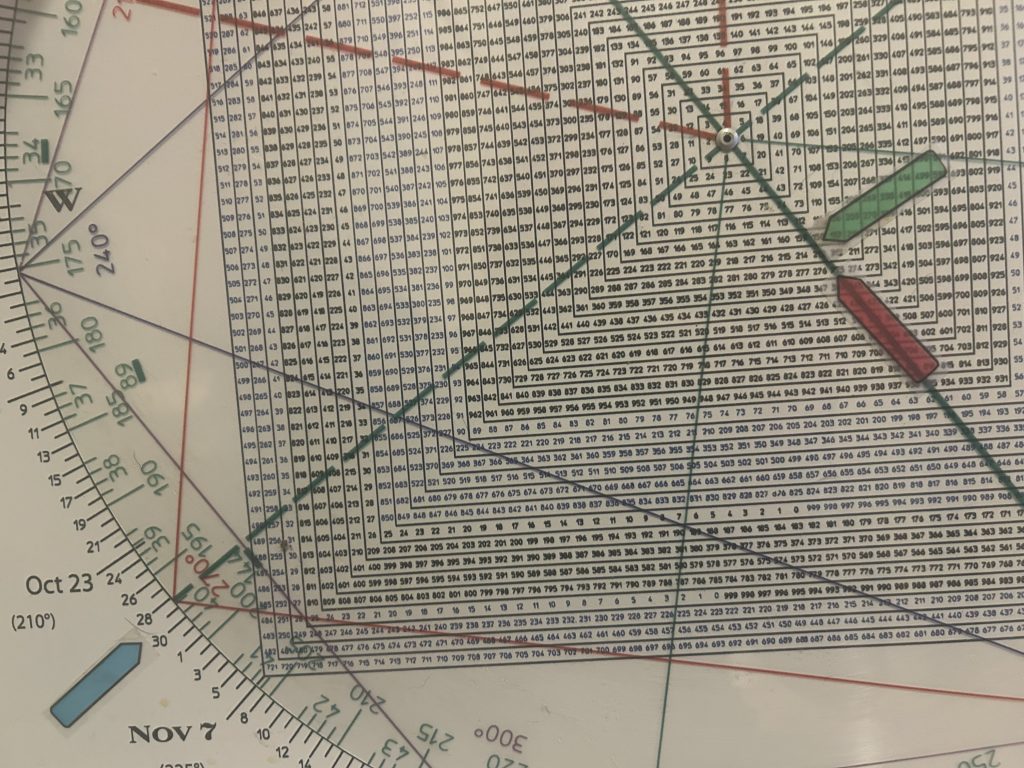
Square of 9 Wheel
Purchase your own Square of 9 Wheel. Shipping to US only. Contact Jeff for shipping outside the US.